Intro
This tutorial will introduce the process of reverse engineering a game. We’ll use the Game Boy Advance game Pokémon Mystery Dungeon: Red Rescue Team for demonstration purposes, although most concepts discussed here can be applied to other games.
What is this tutorial about?
This tutorial will walk you through the following:
- Setting up a reverse engineering environment.
- A basic introduction to assembly code.
- Using the reverse engineering tool Ghidra to analyze assembly code.
- Exploring debugging features of the mGBA emulator to inspect a game’s memory and debug the game while it is running.
- Reverse engineering strategies for finding game mechanics and data.
If you are interested in reverse engineering a Nintendo DS game, this tutorial also has a version for DS games, which have additional frills compared to GBA games. If you are looking for a general overview of reverse engineering, I recommend sticking with this GBA version of the tutorial.
What skills do I need to follow this tutorial?
- Programming knowledge (ideally C or C++), along with the following programming concepts:
- Pointers
- Structs
- Bitwise operations
- Hexadecimal (base 16) numbers
- Basic fluency with using an emulator to play games.
- Interest in reverse engineering games!
Table of contents
- Intro
- Table of contents
- What is reverse engineering?
- Setting up a reverse engineering environment
- Assembly primer
- Using Ghidra
- Debugging with mGBA
- Reverse engineering strategies
- Conclusion
What is reverse engineering?
In the context of programming, reverse engineering is the process of figuring out how a program works without access to the program’s original implementation, i.e., source code, documentation, etc. Most games do not release their source code publicly, but it’s possible to learn and reconstruct many details about a game by analyzing binary data in the game files.
There are several reasons to reverse engineer a game:
Knowledge
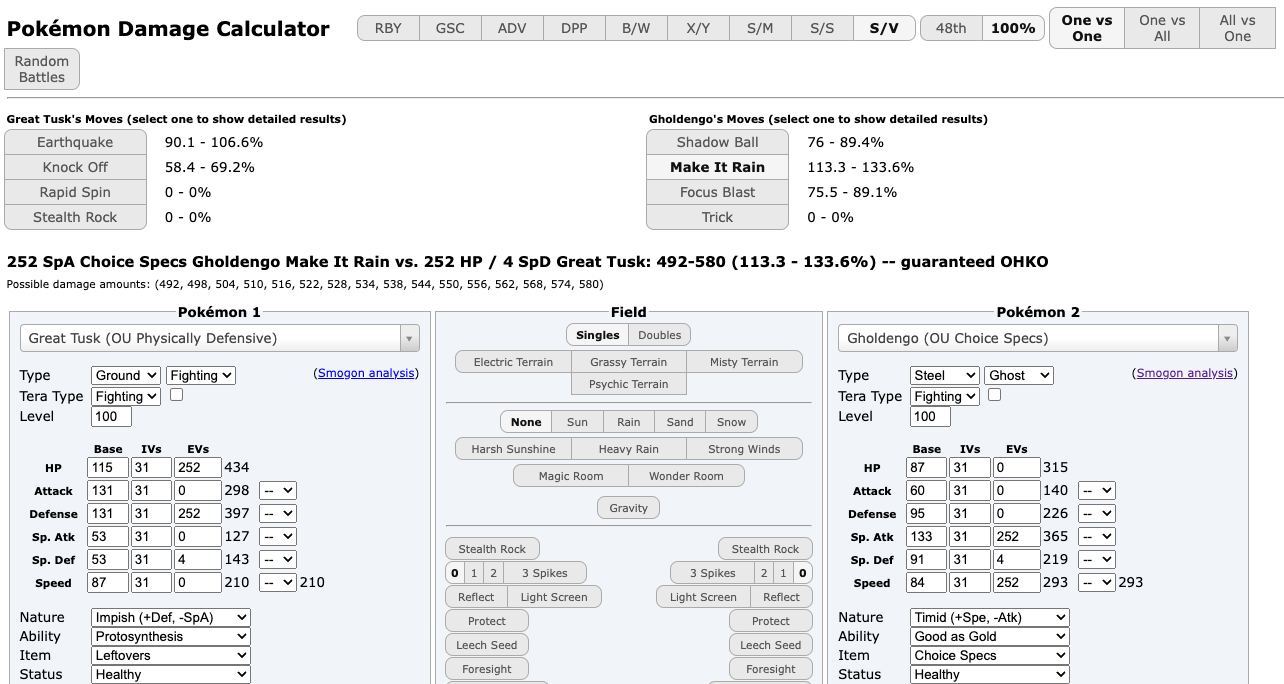
Games hide many details about their mechanics and implementation, and empirical experimentation in-game only gets you so far. Enter reverse engineering, where you can analyze the game’s code and find out precisely how a game works. With enough game knowledge, people can apply this knowledge to build useful tools like a damage calculator for Pokémon battles, or even an entire battle simulator.
Behind this damage calculator is a complicated formula, discovered through reverse engineering.
Modding/Hacking
How do you build custom levels in games without a built-in level editor, create a cheat code that lets you fly infinitely, or give your character a silly custom weapon? Most of the time, people reverse engineered the game and figured out how to modify the game code to add these features. Cheat codes, namely those for devices such as the GameShark and Action Replay, also require reverse engineering to create; a cheat code is simply a set of encrypted instructions for the cheat device to set specific values in memory or inject small amounts of code into the game.
Exploiting glitches
There is a category of glitches called arbitrary code execution (ACE) that allows a player to inject code into a game to perform basically anything the hardware supports. This includes giving yourself infinite items, instantly warping to the end credits, or turning a SNES into a Skype video chat. ACE requires detailed knowledge of the game’s code to exploit to its fullest, and reverse engineering plays a large part in crafting these exploits.
Just a normal SNES running The Legend of Zelda: A Link to the Past. With massive glitches and arbitrary code execution.

Datamining future content
In games with recurring content updates, developers sometimes add new assets into a game prior to their official release. Early-release demos may also hide parts of the full game. Dataminers can reverse engineer games to extract these assets and learn about new content before it is officially revealed.
Setting up a reverse engineering environment
You’ll need the following applications for this tutorial:
- Ghidra - a reverse engineering tool used for static code analysis.
- mGBA - a GBA emulator with debugging and memory viewing capabilities.
- A ROM of Pokémon Mystery Dungeon: Red Rescue Team - the game we’ll reverse engineer. Make sure to use the USA/NTSC version of the game; other versions like the EU/PAL version have differences that change the locations of data and functions.
Setting up Ghidra
Analyzing a function in Ghidra
Ghidra is a free open-source reverse engineering tool developed by the U.S. National Security Agency (NSA). Ghidra can analyze binary data such as a game ROM to output assembly and even decompiled C, which we can read to reverse engineer a game. This kind of analysis occurs without the game running; this is known as static code analysis (as opposed to dynamic code analysis when debugging the game while it is running).
Ghidra is an ideal code analysis and disassembly tool for hobbyists, costing nothing for a fully featured application. There are paid alternatives to Ghidra; the industry standard for professional reverse engineering is IDA. However, the full version of IDA costs thousands of dollars and is too costly for many hobbyists, while the free version doesn’t have enough features for our purposes.
To install Ghidra, follow the instructions on Ghidra’s website.
If you’re on a recent version of macOS, you’ll need to give Ghidra’s decompiler permission to run before setting up a project. Inside Ghidra’s folder, go to Ghidra/Features/Decompiler/os/mac_x86_64, right-click the decompile executable file, select Open, and confirm the Open when macOS warns about not being able to verify the developer.
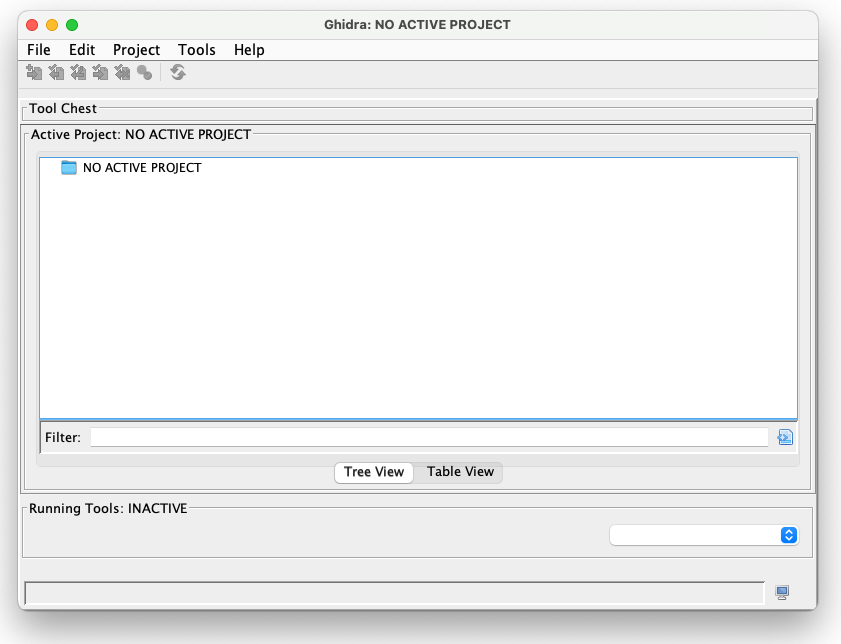
Launch Ghidra after it is installed, and you’ll see this screen.
Ghidra start screen
Let’s make a new project using the Red Rescue Team ROM.
- File > New Project…
- The project defaults to a “Non-Shared Project”. Click Next.
- Choose a project name and a directory to save the project, then click Finish.
- File > Import File…
- Select the Red Rescue Team ROM on your file system.
- Select an instruction set architecture (Language) for Ghidra to use for analyzing the binary. The GBA uses the ARMv4T instruction set in little-endian format (ARM:LE:32:v4t), which you can find by searching for “v4t” in the language select, then selecting the option with “little” under the Endian column.
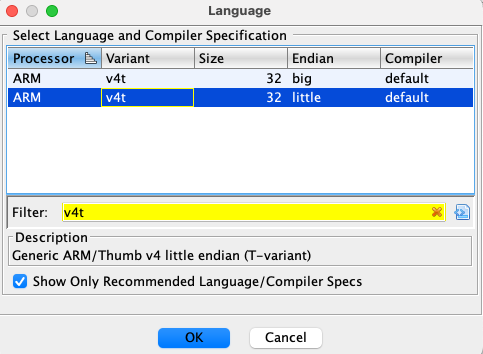
Selecting the ARMv4T language - Click Options… and set the Base Address to 08000000.
- Click OK to make Ghidra inspect the binary.
- Once done, Ghidra will display a report with some details about the inspection. Click OK to continue.
- Double-click the ROM in Ghidra to open Ghidra’s code viewer.
- Ghidra will offer to analyze the binary. Click Yes.
- Use the default analysis settings and click Analyze.
- Wait for Ghidra to analyze the binary. This may take a couple minutes.
- When Ghidra’s analysis finishes, verify whether Ghidra was set up properly. Press ‘g’, enter the value “80450E0”, then press OK. You should see a screen like the image below. At this point, Ghidra is set up to start reverse engineering the game.
Ghidra after setting it up
Setup considerations
How would you know to use the ARM:LE:32:v4t language if I didn’t tell you? First search for which CPU the GBA uses; you’ll find that it uses the ARM7TDMI CPU (e.g., from Wikipedia). Knowing the CPU, you can look for which language/architecture the CPU uses; ARM’s documentation states that the ARM7TDMI uses the ARMv4T architecture.
As for endianness (the order that bytes are stored for each word of data), most ARM CPUs are “bi-endian” and support both little and big endian. In practice, most ARM programs use little endian. If Ghidra spits out incomprehensible disassembled code while using a little endian language, try big endian and see if the output is any better. Note that some CPUs, such as those using the PowerPC instruction set (e.g., the Wii), are predominantly big endian instead.
Setting up mGBA with Red Rescue Team
In addition to Ghidra, you’ll need to set up a GBA emulator and progress the game past the opening sequence.
- Download the latest desktop version of mGBA for your OS from mGBA’s website.
- Install mGBA using the instructions in the download.
- Open mGBA and go to File > Load ROM. Select the Red Rescue Team ROM in your file system.
- View and configure button mappings at Preferences > Controllers if needed.
- Watch the intro cutscene for the game, then start a new game.
- The start of the game consists of a personality quiz that will decide your player character. Answer the questions, honestly or not, then the game will assign you a Pokémon.
- Choose a name for yourself, a partner Pokémon, and a name for your partner.
- After deciding your player and partner Pokémon, you will be taken to a cutscene. After the cutscene, you will enter the first dungeon of the game, Tiny Woods.
- Once you enter Tiny Woods, you are set up to reverse engineer the game.
Red Rescue Team after setting it up
With both Ghidra and the game set up, the next step is to open up the game and read the code. You’ll need to know how to read assembly for this, which the next section will introduce.
Assembly primer
An assembly language (assembly or ASM for short) is a type of low-level programming language that closely matches the raw binary instructions (machine code) read and executed by the computer. Compared to a higher-level language like C, assembly uses fewer abstractions. For instance, a function call is a single-line statement in C, but this operation corresponds to several lines of assembly code. We’ll go into specific examples of this later on.
This tutorial presents a brief introduction of assembly to get you started. For brevity, I’ll be skipping some of the finer details. If you’re interested in a more thorough GBA assembly reference, check out Tonc’s Whirlwind Tour of ARM Assembly. Aside from the assembly guide, Tonc also has detailed documentation on all the inner workings of the GBA console.
Different CPUs may use different assembly languages depending on which operations the CPU supports (the instruction set of the CPU). While all CPUs support the minimum set of instructions required for a computer to function, extra instructions act as shortcuts that allow a program to compile to fewer lines of assembly, resulting in faster program execution in exchange for more complicated CPU hardware to support the additional instructions, and possibly instructions taking more space to store. This tutorial will use the THUMB instruction set, as this is the main instruction set used by Red Rescue Team’s code. Future uses of the word “assembly” in this tutorial will be shorthand for “THUMB instruction set assembly language”; this is a common shorthand in the context of a specific game.
In addition to THUMB, the GBA’s CPU supports another instruction set known simply as ARM, which includes more complicated instructions than THUMB, but allows code to be written in fewer instructions. The ARM instruction set is out of the scope of this tutorial, though most of the concepts in this tutorial can be applied to any assembly language.
Here is a simple assignment instruction in assembly.
movs r0,#0x0
This statement assigns the number 0 (#0x0) to r0. r0 is one of the CPU’s registers. What are registers? Let’s talk about that first.
Registers
A register is a location in the CPU hardware that stores a value. When the CPU needs to store data for later, the registers are the fastest place to store and retrieve the data. Every assembly operation interacts with the registers in some way.
CPUs have a handful of registers available. In ARM CPUs, registers are named with the format rX, where “X” is the 0-indexed register number. The GBA’s CPU has 16 registers numbered from r0 to r15, and each can store up to 32 bits (4 bytes) of data for a total of 512 bits (64 bytes) of data.
r15 is a special register called the program counter (PC for short). This register holds the address to the instruction to be executed next, and is incremented by 2 automatically after an instruction is executed (most instructions are 2 bytes long). This causes assembly to be executed line-by-line. It is possible to set the PC’s value, which will cause the CPU to jump to the new address and begin executing code there; this is used for constructs like conditional statements, loops, and function calls.
Some of the other registers also have special names and purposes. We will get into those later.
Memory
Register capacity is limited, so if a program needs to store more data than the registers allow, the data goes to main memory, also known as RAM (random-access memory) or simply memory. Storing and accessing memory is slower than using registers, but memory has a much larger capacity. The GBA has 288 kilobytes of RAM for regular code operations to use, and also has additional reserved RAM for special operations like I/O.
ROM
The ROM (read-only memory) file used to load the game is effectively an array of bytes. These bytes encode assets like sprites and audio, data values used by the game’s logic (e.g., the amount that a certain healing item will heal the player by), and code used to run the game.
When talking about data in the ROM, it is typical to refer to a piece of data according to its 0-indexed address (offset) from the start of the ROM. For example, the first byte in the ROM file is at address 0x0, and the 5th byte in the ROM file is at address 0x4. Addresses are almost always written in hexadecimal; the “0x” indicates that a value is expressed in hexadecimal format. Hexadecimal is also commonly used for other values in reverse engineering contexts.
When the GBA loads the ROM, the ROM’s data is loaded into an area of memory from address 0x8000000-0x9FFFFFF. This area of memory is often called “ROM” despite technically being part of memory/RAM. In-game, values in the ROM are accessed using their address plus 0x8000000. For example, the data at address 0x4 in the ROM is accessed in-game using address 0x8000004. In the context of ROM addresses, this address can be referred to as 0x4 or 0x8000004 interchangeably.
During Ghidra setup earlier, you set the Base Address of the ROM to 0x8000000. This matches where the GBA loads the ROM in memory, and supplying this address to Ghidra helps it to better analyze the ROM.
Instructions
Instructions are used to manipulate data in registers or memory. The CPU executes instructions in sequence according to the value of the program counter.
Each instruction is encoded in either 2 or 4 bytes of data. When encoded as bytes, the instruction is considered to be in binary code or machine code. Reverse engineering tools can read these bytes and convert them to a more human-readable form, assembly code.
Assignment
Here is the assignment instruction shown earlier:
movs r0,#0x0
There are three parts to this instruction:
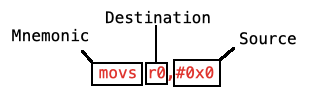
- Mnemonic: The shorthand name of the operation to be performed. A
movsinstruction assigns a value to a register. This instruction sometimes uses the mnemonicmovinstead. - Destination: The register to set the value in. In this instruction, the value of
r0will be set. - Source: The place to retrieve a value to store at the destination. In this case, the value is a constant value of 0; this is known as an immediate value in assembly nomenclature.
Combining all three parts, this instruction sets r0 to a value of 0, discarding the previous value that was in r0.
It is also possible for the source to be another register. The following instruction will copy the value of r1 into r0.
mov r0,r1
The extra ‘s’ in the mnemonic
movsis used for certain assembly languages to distinguish between different assignment operators that set flags or increment registers automatically, speeding up common operations like string assignment. There is no such distinction in THUMB assembly, somovsandmovare used interchangeably. This ‘s’ also appears in other mnemonics.
Arithmetic
Let’s look at a different kind of instruction. The instruction below is an addition operation.
adds r0,r1,#0x1
This instruction adds 1 to the value in r1 and stores it in r0.
r0 is the destination register like before. Since addition requires two operands, there are two sources, r1 and #0x1. It is possible to add either a register and an immediate value, or two registers. If the instruction uses an immediate value, the immediate value must always come last; this constraint has to do with how the instruction is implemented in the CPU’s hardware.
In the special case where you want to add an immediate value to a register value and store the new value back in the same register, you can use the following shorthand.
adds r0,#0x1
This will add 1 to the value of r0 and store the sum in r0. Alternatively, you can say that this increments the value in r0.
Other available math operators include subtraction, multiplication, negation, bitwise AND/OR/XOR/NOT, and logical/arithmetic (unsigned/signed) left/right bit shifts. Some of these operations are more rigid than addition, such as not supporting immediate values, though they all follow a similar structure. For a full list of supported instructions, refer to ARM’s developer documentation.
You may notice the lack of a division instruction. Division with arbitrary numbers is more complicated than the operations listed above, so it is implemented as a function rather than a single instruction. This means division is much slower than other math operations. Note that the right shift operator can divide numbers by powers of 2 to achieve certain divisions in a single instruction.
Load/Store memory
Registers can only store a handful of values, so memory is used to store the majority of a program’s data. As a reminder, memory (also called main memory or RAM) is where most data is stored given that registers have limited storage capacity.
Here is an instruction that stores to memory.
str r0,[r1,#0x4]
- The mnemonic “str” stands for “store register”.
r0is the source register, containing the value to store in main memory.- The bracketed values
r1(register) and#0x4(can be immediate value or register) are added together, and the sum is the address in main memory to store the value in. The immediate value can be 0 to store the value directly to the address inr1.
For example, if r0 is 3 and r1 is 0x2000000, the value 3 will be stored to memory address 0x2000004 (0x2000000 + 4). Since a register value is 4 bytes long, the full value be stored in memory addresses 0x2000004 to 0x2000007 (inclusive).
Alternate instructions strh and strb are used to store the lowest 2 bytes (halfword) and 1 byte of the source register, respectively.
Loading from memory uses a similar format, except data flows in reverse.
ldr r0,[r1,#0x4]
“ldr” stands for “load register”. This command loads from the address stored in r1 plus the immediate offset of 4, storing the loaded value in r0. Like str, there are instructions to load halfwords (ldrh) and single bytes (ldrb).
In addition to load from a register address, ldr can also load hard-coded values in the assembly code. These are marked with DAT_<address> in Ghidra, where <address> is the address of the value in the ROM.
ldr r0,[DAT_08090fe8]
...
DAT_08090fe8
  02000010
This will load the value 0x2000010 into r0.
Ghidra marks data values with
DAT_<address>for convenience. Under the hood, theldrinstruction contains a 10-bit offset from the instruction’s address in ROM to the data value’s address.
Branches
All the instructions covered so far are executed line-by-line in order. The program executes an instruction, increments the program counter by 2 (the number of bytes per instruction), executes the next instruction in memory, and so on. For example, if the program counter starts with a value of 0x8000000, program execution is as follows:
- Execute the instruction at address 0x8000000.
- Increment the program counter to 0x8000002.
- Execute the instruction at 0x8000002.
- Increment the program counter to 0x8000004.
- Execute the instruction at 0x8000004.
And so on.
Branches, also known as conditionals or jumps, are instructions that set the program counter to a specific value, causing program execution to jump to the specified instruction.
Here is an unconditional branch instruction.
b LAB_08090fde
LAB_08090fde is known as a label. The label represents a certain instruction in memory; in this case, the label refers to the instruction at address 0x8090FDE in the ROM.
Taking the previous example, if the branch instruction above is at address 0x8000002:
- Execute the instruction at address 0x8000000.
- Increment the program counter to 0x8000002.
- Execute instruction
b LAB_08090fdeat 0x8000002. - The branch instruction sets the program counter to 0x8090FDE.
- Execute the instruction at 0x8090FDE.
- Increment the program counter to 0x8090FE0.
- Execute the instruction at 0x8090FE0.
And so on. After branching, the program counter resumes incrementing and executing instructions in order.
Like with data values, the branch instruction contains an offset from the instruction’s address under the hood to determine where to jump to. For branch instructions, the offset is 11 bits long.
In addition to the b instruction, there are other unconditional branch instructions for certain cases:
bl: Branch instruction used to call functions, which will be discussed later.bx: Branch to an address stored in a register.
Conditional branches
It is possible to have branch instructions that only execute if a condition is satisfied. If the condition is not satisfied, the conditional branch instruction is skipped, and the program counter increments and continues to the next instruction.
A conditional branch consists of two instructions. Here is an example.
cmp r0,#0x1
beq LAB_08090f14
With this set of instructions, if the value of r0 is equal to 1, then the program branches to LAB_08090f14. If r0 is not equal to 1, then the program skips the branch and moves to the next instruction instead.
- The
cmpinstruction is used to set up a conditional branch by comparing two values. The first value is always a register, and the second value can be either an immediate value or another register. - All conditional branch instructions start with the letter ‘b’ and end with a mnemonic extension, also known as a conditional code, that specifies what kind of condition needs to be met. In this case, the extension
eqsignals that the branch will be taken if the compared values are equal.
All basic comparison operators are supported by conditional branch instructions:
- Equal:
beq - Not equal:
bne - Greater than:
bgt,bhi - Greater than or equal:
bge,bcs - Less than:
blt,bcc - Less than or equal:
ble,bls
Equality and non-equality have a single instruction each, while the other comparison operators have different versions to support unsigned integer, signed integer, and floating-point comparisons. A full list of the conditional codes for each comparison operator can be found in ARM’s developer documentation.
A higher-level language like C uses conditional keywords like if/else if/else and looping keywords like while/do while/for. These constructs typically translate to conditional branch statements when compiled to assembly.
Internally, the
cmpinstruction sets four 1-bit condition flags in the CPU, named C, N, V, and Z. Each conditional branch instruction checks specific condition flags to decide whether to branch. For example, thebeqinstruction will branch if the Z flag has a value of 1. Chances are that you won’t need to interact directly with these condition flags; knowing the conditional codes is sufficient.
Functions
Conceptually, functions in assembly work similarly to functions in higher-level languages. A function can be invoked/called, which will cause the function to run before returning back to the code that called the function. Functions can also have parameters and return values. Let’s look closer into how functions work in assembly.
A function can be called as follows:
bl FUN_080450f8
bl is a special branch instruction used for functions. In this case, the program will jump to the first instruction of the function FUN_080450f8. Before branching, the current value of the program counter is saved to the link register (lr), which corresponds to r14 for the GBA’s CPU. The link register’s value will be retrieved at the end of the function to return the program to the place where the function was called.
Here is a simple function:
FUN_080450f8

ldr r0,[r0,#0x0]
bx lr
By default, Ghidra names functions according to the memory address where they start at. This function starts at memory address 0x80450F8, so the function is named FUN_080450f8.
Most functions have three parts: a prologue, a body, and an epilogue. The prologue and epilogue consist of standard setup and cleanup for function execution, while the body is the main logic that the function will execute. In the function above:
- The function is simple enough to have no prologue.
- The body consists of the instruction
ldr r0,[r0,#0x0]. - The epilogue contains the instruction
bx lr. This will set thepcto the value inlr, which causes the program to return to the place that called the function.
Once the function returns from the epilogue to the caller function, the pc is incremented as usual, causing the program to continue at the instruction directly after the function call.
Function arguments/parameters
To pass arguments into a function, the arguments are stored in registers before calling the function. r0-r3 are used to pass arguments; if the function requires more than four arguments, any further arguments are pushed onto a place called the stack, which will be discussed later on.
In the code below, a value is assigned to r0 to pass as an argument into FUN_080450f8.
...
adds r0,r4,#0x0
bl FUN_080450f8
Once inside the function, the function can use the argument from r0.
FUN_080450f8

ldr r0,[r0,#0x0]
...
Return values
If a function needs to return a value, the return value will be stored in r0 just before the function returns. The caller function can use the return value in r0 as needed.
In function FUN_080450f8, the function body assigns a value to r0 before returning with bx.
FUN_080450f8

ldr r0,[r0,#0x0]
bx lr
The caller can call the function, then retrieve the return value from r0 to use for processing.
bl FUN_080450f8
cmp r0,#0x1
...
Call stack
When a function is called, the caller is likely already using the registers to store values. There are only a handful of registers, and the function may also need those registers to do its work. Before the function can use the registers, it should save the existing values of registers it plans to use. When the function is finished, it should restore the saved values back to the registers so the caller doesn’t lose its current state when it resumes execution.
Registers r0-r3 and r12 are designated as scratch registers, which are not saved by a function that uses them. Registers r4-r11 are preserved registers (or variable registers) whose values are saved and restored by the function. lr is also saved if the function calls other functions.
Since a function can call another function, which can itself call another function and so on, every function must store and restore the register values at the proper times. This is accomplished using a place in memory called the call stack.
The call stack, often shortened to stack, is a special place in memory used to save register values when functions are called. It is also used to store local variables if there are too many for the registers to hold. As the name implies, it is a last-in first-out (LIFO) data structure.
In most GBA games, the stack is located in memory at addresses 0x3000000-0x3007FFF. The top of the stack starts at address 0x3007FFF at the beginning of program execution. As values are pushed onto the stack, the top of the stack moves down. The address at the top of the stack is tracked using r13, often called the stack pointer (sp).
One of the main purposes of the function prologue is to save register values to the stack. Register values are pushed onto the top of the stack (i.e., the address of sp) using the push instruction. The instruction also decrements sp to reflect the new top of the stack.
Here is an example prologue that saves a register value.
push { lr }
This prologue is taken from a function that calls another function with bl, which will overwrite the existing value in lr. Therefore, the function must save the current value of lr in the stack.
In the function epilogue, saved register values are restored to their saved values by using the pop instruction. This is the corresponding epilogue to the prologue above.
pop { r1 }
bx r1
pop will remove the value at the top of the stack and assign it to the specified register. pop also increments sp to move the top of the stack past the items that were popped off.
When lr is pushed onto the stack, it is typically popped into either r0 or r1 in the epilogue for the subsequent bx instruction to return to the caller. If the function is already using r0 to return a value, it will pop the return address into r1; otherwise, it will pop the address into r0.
If there were other registers to save and restore, the prologue and epilogue may look like the following:
push { r4, r5, r6, r7, lr }
...
pop { r4, r5, r6, r7 }
pop { r1 }
bx r1
Along with lr, this will save and restore the values of registers r4 through r7.
In addition to saving and restoring register values, the stack is used for a couple other purposes.
Stack local variables
If a function has many local variables or large local variables like structs or arrays, it may run out of registers to store all the variables. If this happens, the excess values are stored in the stack. An occurrence of this may look like the code below.
sub sp,#0x1c
...
str r0,[sp,#0x4]
...
add sp,#0x1c
In the function prologue, the stack pointer is subtracted by 0x1c to make room for local variables. The function stores and loads local variables on the stack by using an offset from sp. In the function epilogue, the function cleans up the allocated local variable space by adding back to sp.
In Ghidra, stack local variables are assigned names such as local_24 based on their position in the stack, rather than displaying the raw offset from sp. The number is derived by taking the total size of the local variable region (0x1c) and subtracting the offset of the variable (0x4), before converting to decimal. 0x1c - 0x4 = 0x18 = 24.
Stack function arguments
There are four registers allotted for passing arguments into a function. If the function needs more than four arguments, additional arguments are passed by storing them on the stack. The stack is also used for passing larger data types such as structs and arrays.
Below is an example of passing five arguments into a function.
// Prologue
sub sp,#0x4
...
// Body
str r2,[sp,#0x0]
adds r0,r5,#0x0
adds r1,r4,#0x0
mov r2,r9
adds r3,r6,#0x0
bl FUN_08073b78
...
// Epilogue
add sp,#0x4
Like with stack local variables, the prologue subtracts from sp to allocate stack space for passing a function argument on the stack. When the function FUN_08073b78 is called, r0-r3 are used for four of the arguments, and the stack is used for the last argument (set with str r2,[sp,#0x0]). The epilogue adds to sp clean up the stack space.
Inside FUN_08073b78, the function accesses the stack argument via an offset from sp.
FUN_08073b78

...
ldr r0,[sp,#Stack[0x0]]
...
The patterns above for passing arguments, returning values, saving registers, and allocating local variables are all part of the ARM calling convention, a set of standards for how assembly code should use registers and memory when calling functions to ensure correct execution of the program. If you write higher-level code like C, the compiler will generate assembly code that follows the calling convention. If you write assembly code by hand, there’s nothing stopping you from violating this convention, but deviating from the convention is bad practice and can easily lead to bugs.
Structs
By analyzing the assembly code, it is possible to tell when a struct from a higher-level language like C is compiled down to assembly.
In C, a struct definition may look like the following. For this tutorial, assume that int has a size of 4 bytes:
struct Position
{
    int x;
    int y;
}
This struct has a size of 8 bytes. Since x is the first variable defined in the struct, it is located at the start of the struct (i.e., an offset of 0). x takes up 4 bytes, so the following variable, y, has an offset of 4 from the start of the struct.
Typical assembly code maintains a pointer to the start of a struct, using offsets to access each of the struct’s fields. The following code is an example of storing values into a struct.
ldr r0,[DAT_08073b70] // Load the address of a Position.
movs r1,#0x6
str r1,[r0,#0x0] // position.x = 6;
movs r1,#0x4
str r1,[r0,#0x4] // position.y = 4;
Within reverse engineering communities, it is common to have a struct field whose purpose is not yet known. Unknown fields are often named by the community according to their offsets. For example, if the struct above was not yet identified as a struct that stores position data, it might use names like the following:
struct unkStruct
{
    int unk0;
    int unk4;
}
Copying struct data
A common operation with structs is copying values from one struct to another. There are special instructions for loading and storing values in bulk: ldmia and stmia.
The ldmia instruction stands for “load multiple, increment after”, and looks like this:
ldmia r1!,{ r3, r4, r5 }
r1 contains the initial address to load data from. For each of the registers in brackets, 4 bytes of data will be loaded into the register from the address in r1, then r1 is incremented by 4. This results in 12 bytes of data from the address in r1 being loaded into the registers r3, r4, and r5.
For example, if r1 initially contains the address 0x2000000, the ldmia instruction will do the following:
- Load the value at address 0x2000000 to
r3. - Increment
r1to 0x2000004. - Load the value at address 0x2000004 to
r4. - Increment
r1to 0x2000008. - Load the value at address 0x2000008 to
r5. - Increment
r1to 0x200000C.
It is also possible to pass a range of registers to load into rather than listing each individual register.
ldmia r1!,{ r3-r5 }
The “!” in the instruction indicates “write-back mode”, which means the source register is incremented by the instruction. In some instruction sets, it is possible to omit the “!” to keep the source register unchanged, but the ARM7TDMI only supports
ldmiawith write-back enabled.
The stmia instruction (store multiple, increment after) works similarly to ldmia, except it stores the value in each of the bracketed registers into an address. Like ldmia, stmia can take a list of individual register or a register range.
stmia r2!,{ r3, r4, r5 }
If r2 initially contains the address 0x2000000, the stmia instruction will do the following:
- Store the value in
r3to address 0x2000000. - Increment
r2to 0x2000004. - Store the value in
r4to address 0x2000004. - Increment
r2to 0x2000008. - Store the value in
r5to address 0x2000008. - Increment
r2to 0x200000C.
With both ldmia and stmia, the incremented register’s address ends up at the address immediately after the last value loaded/stored. This makes it possible to chain ldmia/stmia to copy data of any size. A chain of these instructions may look like the following:
ldmia r1!,{ r3, r4, r5 }
stmia r2!,{ r3, r4, r5 }
ldmia r1!,{ r3, r4, r5 }
stmia r2!,{ r3, r4, r5 }
These instructions copy 24 bytes of data from the address in r1 to the address in r2.
Using ldmia and stmia, copying data from one struct to another takes far fewer instructions than it would by copying each field individually.
Arrays
In assembly, there are several ways that array access can be implemented.
In several ways, arrays are similar to structs. If accessing a hard-coded array index (i.e., outside of a loop), offsets are used to access the data, similar to structs. Copying array data is also similar to copying structs, often using the same ldmia/stmia instruction chains.
If an array is accessed in a loop, it is still possible to use offsets, though the offset must be incremented or recalculated for each array element. The following example iterates through a size-5 array of 4-byte values (e.g., pointers).
ldr r2,[DAT_08073b70] // Load pointer to start of array.
movs r6,#0x0 // Initialize array index.

LAB_08073ac0
lsls r1,r6,#0x2 // Calculate array offset by left-shifting by 2 (multiplying by 4).
ldr r0,[r2,r1] // Load current array element.
... // Process current array element.
adds r6,#0x1 // Increment array index.
cmp r6,#0x5
ble LAB_08073ac0 // Go back to loop start if iteration is not finished.
Alternatively, a pointer to the current array element can be initialized from the array pointer and incremented.
ldr r2,[DAT_08073b70] // Load pointer to start of array.
movs r6,#0x0 // Initialize array index.

LAB_08073ac0
ldr r0,[r2,#0x0] // Load current array element.
... // Process current array element.
adds r6,#0x1 // Increment array index.
adds r2,#0x4 // Increment current array element pointer.
cmp r6,#0x5
ble LAB_08073ac0 // Go back to loop start if iteration is not finished.
Switch statements
In assembly, switch statements are usually implemented using a jump table. An array of instruction addresses is stored in assembly, and the array is accessed using the value passed into the switch statement. The resulting array element is assigned to pc to jump to the code for the corresponding switch case.
For example, let’s take a simple switch statement in C:
int type;
// Logic to assign type variable
switch (type)
{
    case 2:
    case 3:
    case 5:
        // Logic to handle case.
        break;
    case 0:
    case 1:
        // Logic to handle case.
        break;
    case 4:
        // Logic to handle case.
        break;
    default:
        break;
}
The switch statement above may look like the following in assembly:
// Logic to assign r0 (type variable).
...
cmp r0,#0x5
bls LAB_08048f48 // Only use switch statement if value is in range of switch cases.
b LAB_080494e0 // Go to end of function and do nothing if value is out of range.

LAB_08048f48
lsls r0,r0,#0x2 // Multiply type by 4 to get jump table array offset.
ldr r1,[DAT_08048f54] // Load jump table pointer
adds r0,r0,r1 // Get address to jump table entry based on type.
ldr r0,[r0,#0x0] // Load jump table entry.
mov pc,r0 // Jump to jump table entry for type.

DAT_08048f54
addr DAT_08048f58 // Address to jump table
// Jump table
addr LAB_0804928c // Address to logic for cases 0 and 1.
addr LAB_0804928c
addr LAB_08049296 // Address to logic for cases 2, 3, and 5.
addr LAB_08049296
addr LAB_08049408 // Address to logic for case 4.
addr LAB_08049296
Small switch statements often forgo a jump table and use a series of conditional branches instead.
Assembly primer wrap-up
If you’ve made it this far, you now have the baseline knowledge to read the GBA’s THUMB assembly code and identify some of the most common assembly patterns. While there are a number of less common assembly operations and patterns not covered in this tutorial, you should have enough context to fill in the gaps as needed with documentation such as the official ARM docs, Tonc, and your favorite search engine. Like most skills, practice is the best way to improve your assembly reading skills.
The next step is to explore the tools that will help with reverse engineering a GBA game. We’ll start with our static code analyzer, Ghidra.
Using Ghidra
Ghidra is a powerful reverse engineering tool with a rich set of features. This section will go over some basic Ghidra usage to get you started with reading assembly.
The Ghidra interface looks like this:
There are two main areas of the Ghidra workspace that we will be using.
- The center window is the listing. This is where assembly code is displayed.
- The window on the right is the decompiler, which analyzes the assembly code for the currently selected function and decompiles it to C.
There are other windows in the Ghidra interface, but this tutorial will not go into them. You can close them to give more room to the listing window.
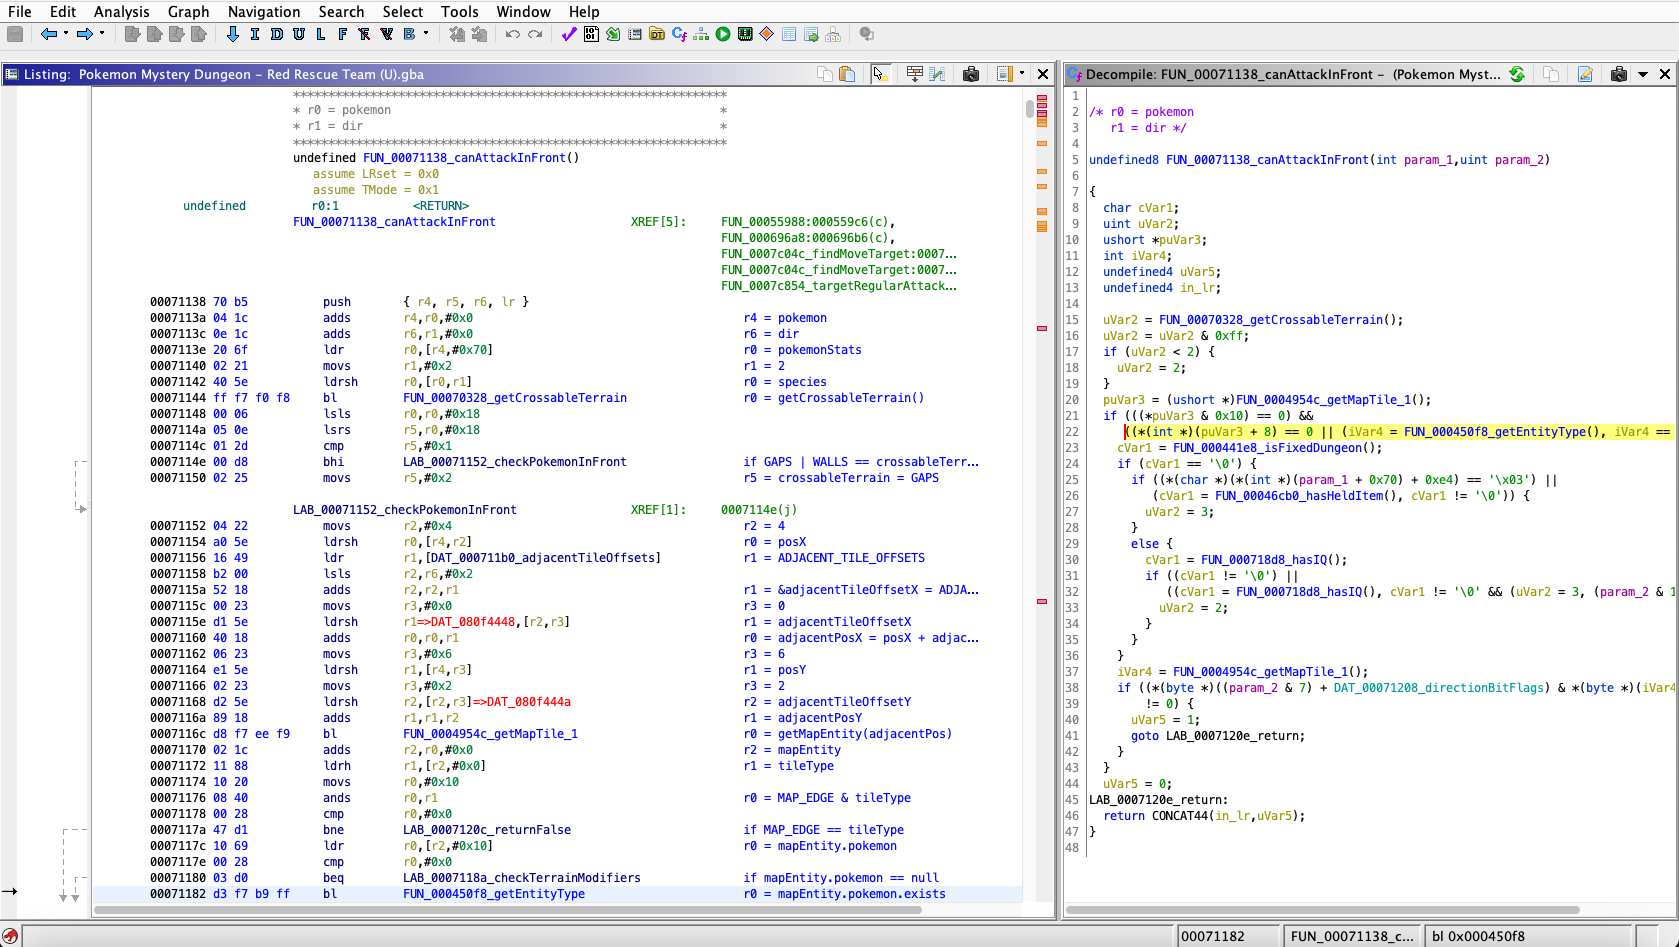
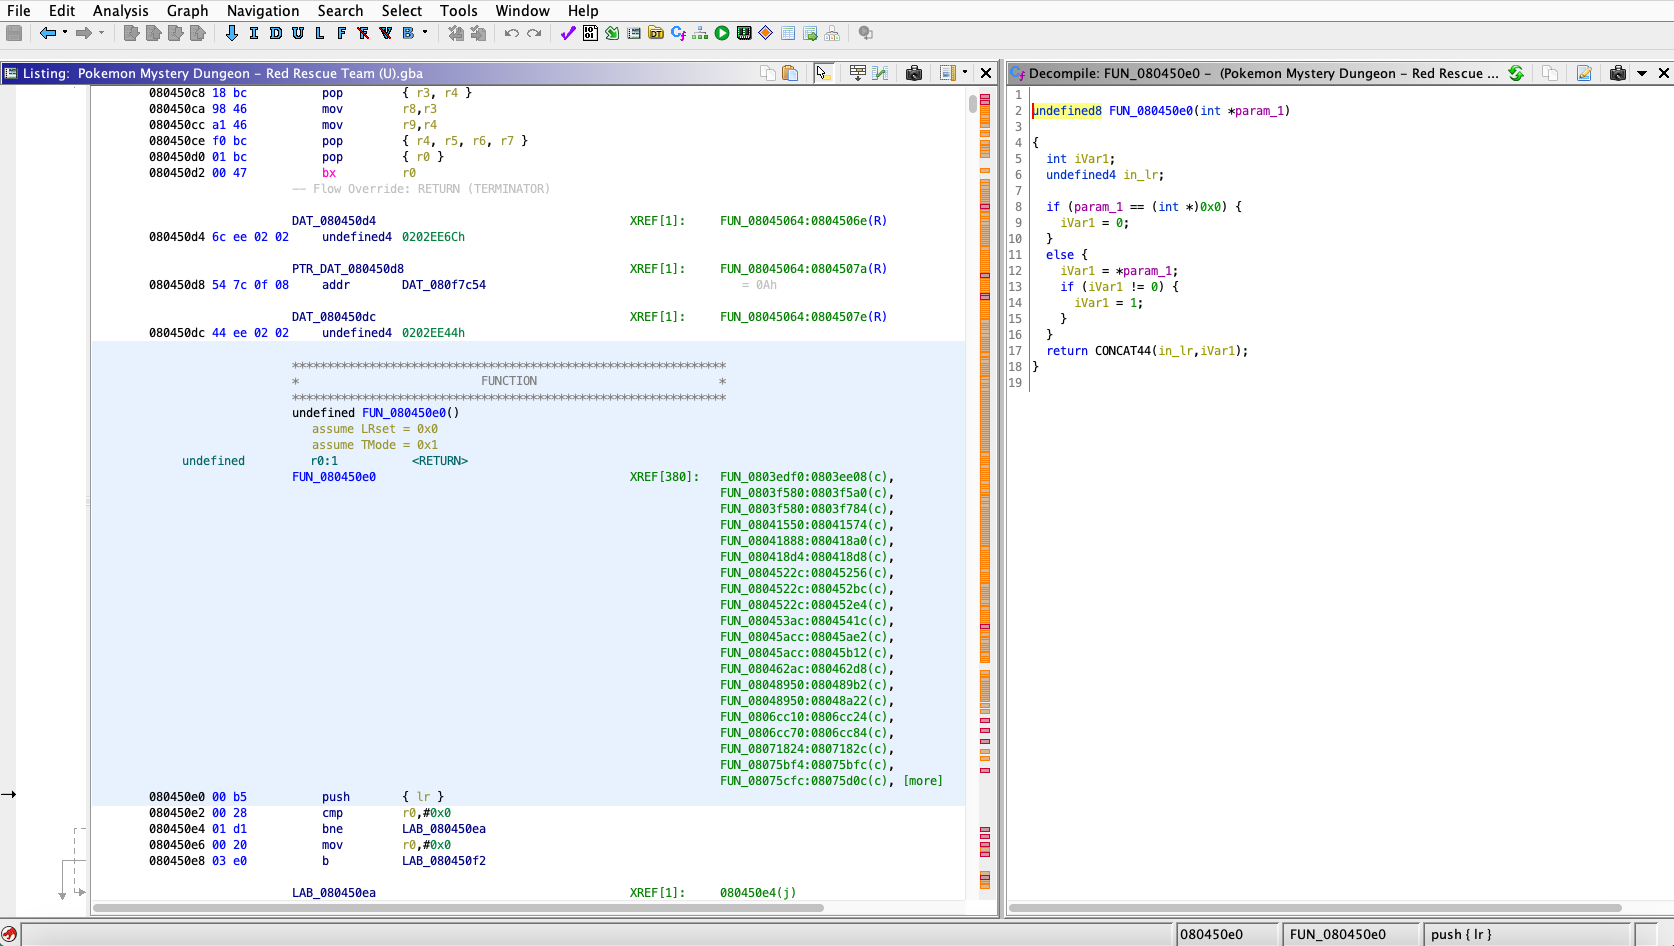
For this demonstration, we’ll use the function at address 0x80450E0. To navigate to this address, press ‘g’ and enter in “80450E0”. Scroll down a bit to see the whole function, which looks like this:
FUN_080450e0 in Ghidra
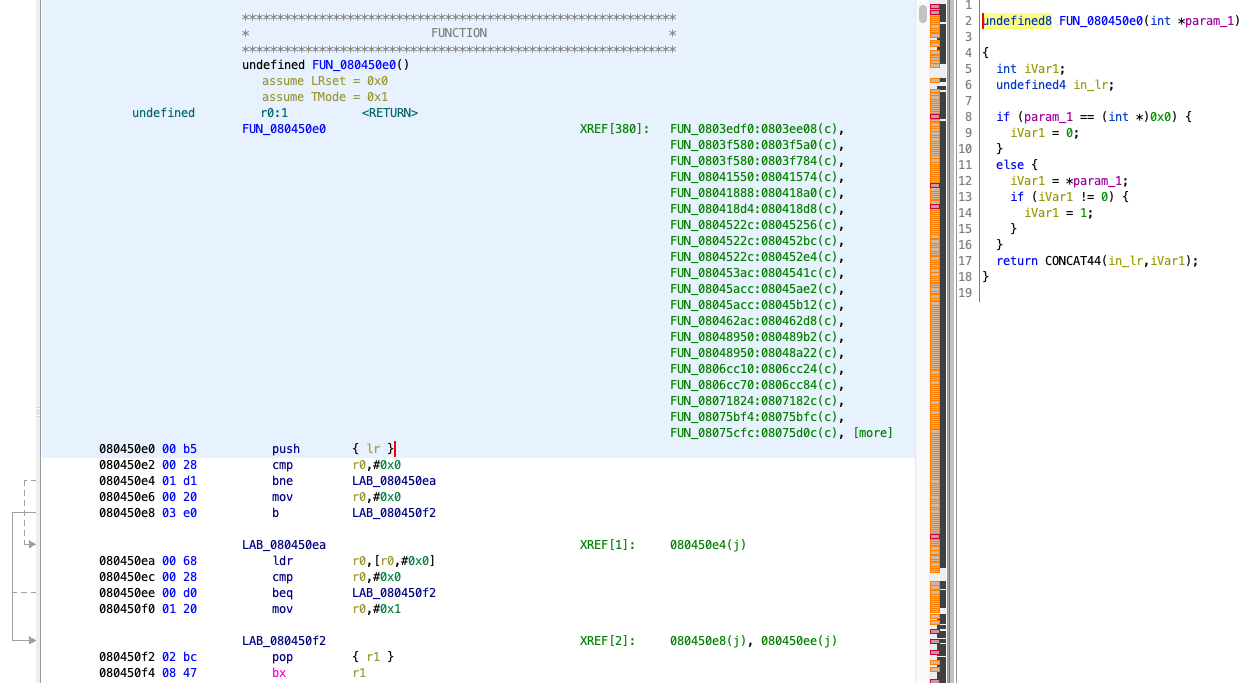
Let’s break down what is on the screen.
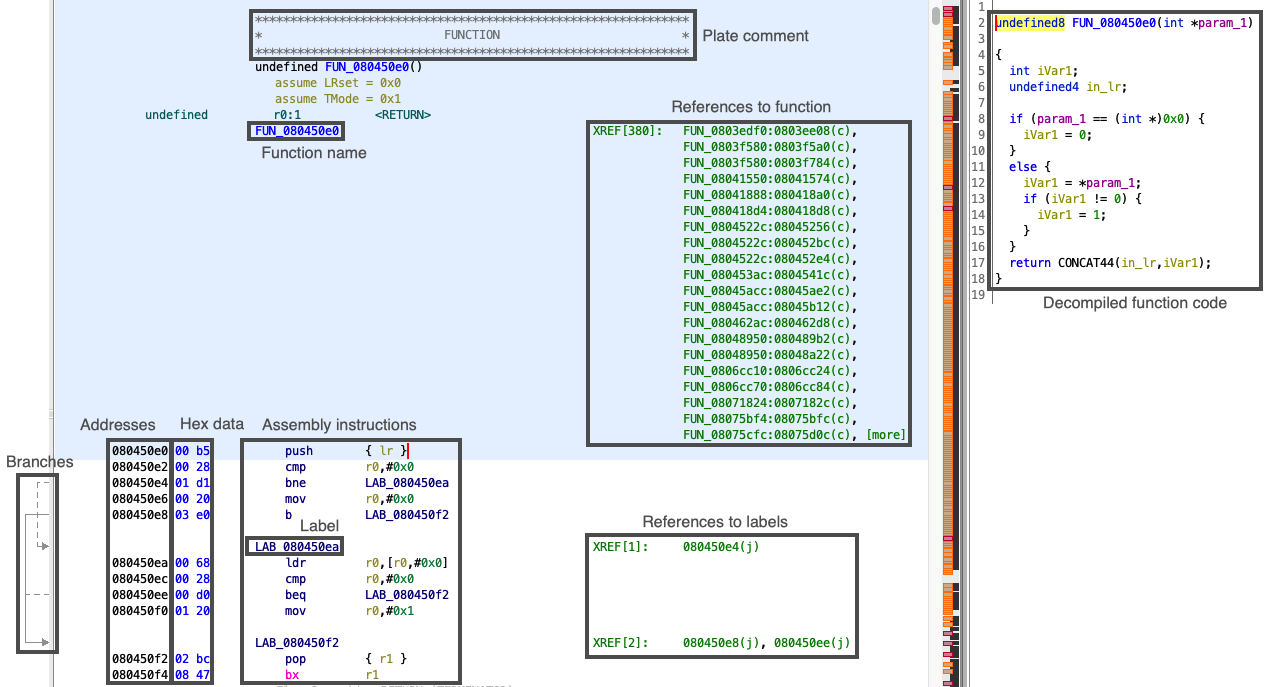
- Function name is self-explanatory.
- It is possible to add comments to the assembly code. A plate comment is a comment that takes up several lines. Ghidra automatically adds a plate comment to denote functions, and it is possible to add more yourself (we’ll talk about that later).
- The references to function section lists all the places in the assembly code that call the current function. The list is in the format “function-name:instruction-address”. In this case, Ghidra found 396 places that call
FUN_080450e0, one of which isFUN_0803edf0with ablinstruction at address 0x803EE08. - Assembly instructions is where the actual assembly code is, along with labels to denote branch destinations and hard-coded data values.
- Hex data contains the raw hexadecimal values in the ROM file that correspond to the assembly instructions. The
push { lr }instruction at the start ofFUN_080450e0is derived from the hex value00 b5in the ROM. - The addresses contain the addresses/offsets of each instruction from the start of the file. The
push { lr }instruction at the start ofFUN_080450e0is at address 0x80450E0 in the ROM. - The branches section contains arrows that denote branches in the function; the start of the arrow is the branch instruction, and the end of the arrow is the instruction that the branch will set
pcto. - References to labels lists the places that branch to each label. Listed here is the address of each branch instruction to a given label. For example,
LAB_080450eais referenced by thebneinstruction at address 0x80450E4. - The decompiled function code in the decompiler window contains decompiled C code for the function.
Decompiler
The decompiler is a tool that attempts to decompile assembly code into C code. Since C is a higher-level language than assembly, it is sometimes faster to read the decompiled C code than assembly code when figuring out how a function works.
With the existence of a decompiler, you may be wondering: what’s the point of learning to read assembly code if it can be decompiled to C?
- Since the C code is generated instead of manually written, it is often harder to read than the raw assembly code.
- The decompiler is not perfect, and sometimes it may fail to decompile the function. For example, jump tables often give the decompiler trouble.
- When debugging the game while it is running, you will be stepping through assembly code rather than C code.
- Depending on your goals with reverse engineering, it is often necessary to use assembly rather than decompiled C code. For example, if you want to make a patch to the game by changing the code, you must do this via assembly rather than C (unless the reverse engineering community for the game has created tools to inject compiled C code in the ROM, which is rare).
Treat the decompiler as another tool in the toolbox rather than relying solely on it. Chances are that you will switch between reading the raw assembly and reading the decompiled C code based on the current task at hand.
Navigation
There are several ways to navigate through code within Ghidra.
- As demonstrated before, pressing ‘g’ (Go To…) allows you to jump to a specific address in the ROM.
- Double-clicking on a function, label, or reference to a function/label will jump to the corresponding location in the ROM.
- On the toolbar at the top of the Ghidra window, there are buttons to navigate back and forward. These buttons keep track of your history when jumping to different addresses via Go To… or when clicking on functions and labels. You can hover over these buttons to see keyboard shortcuts for them (which may differ based on your OS).
Highlighting
Ghidra allows you to highlight certain corresponding elements, which are useful when visually inspecting the code.
- Clicking a line of assembly will highlight the corresponding line of decompiled C code. Likewise, clicking a line of C code will highlight the corresponding assembly code.
- Middle-clicking a symbol in Ghidra will highlight all occurrences of the symbol. For example, you can middle-click an occurrence of
r1in the assembly to highlight all other places wherer1is used. - Right-clicking a variable in the decompiler and choosing Highlight > Forward Slice or Highlight > Backward Slice will highlight all other variables whose data flows from/to the variable you selected.
Comments
You can add comments to the assembly code by right-clicking an assembly instruction and going to Comments in the context menu. There are options to position the comment in several places, including end-of-line (EOL), pre-line, post-line, and plate comments. The default keybind ‘;’ will open the comment interface for EOL comments, and you can also assign key bindings to the other types of comments in Edit > Tool Options > Key Bindings.
Here is an example end-of-line comment.
End-of-line comment
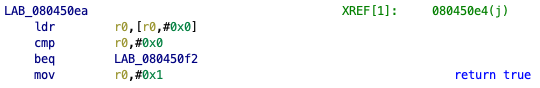
Liberal use of comments is highly recommended. There are no descriptive variable names in assembly, so it is easy to get lost if you don’t leave notes for yourself.
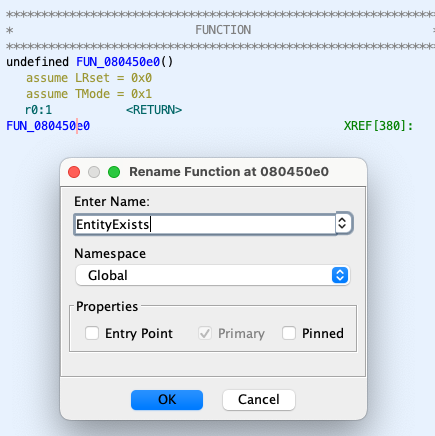
Label names
Once you figure out what a function, branch label, stack value, or data value does, you can rename it by right-clicking the label and clicking Edit label (hotkey ‘L’). You can also edit variable names in the decompiler.
Renaming a function’s label
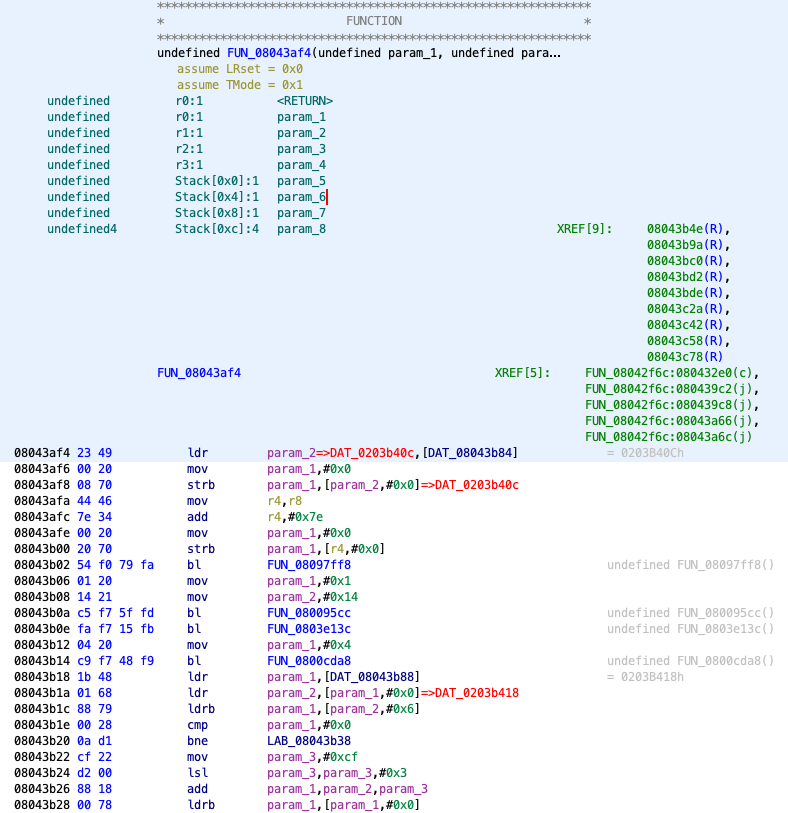
Sometimes Ghidra’s disassembler will automatically label registers as parameters. This is rarely helpful because registers are reused for many variables throughout the function. An example of this is FUN_08043af4.
Registers have been replaced with parameter labels
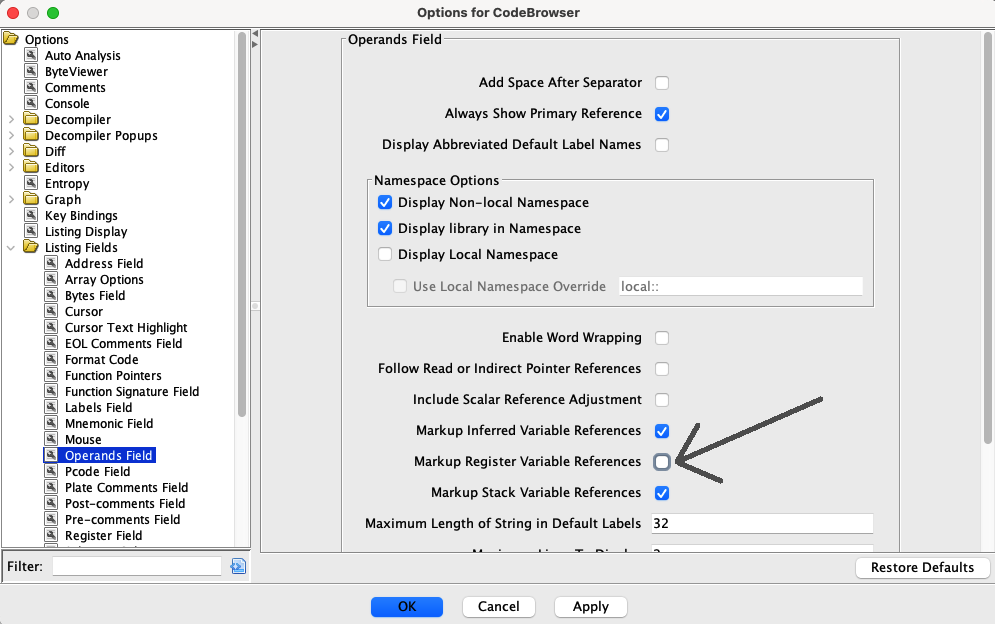
To remove these labels, go to Edit > Tool Options…, select Options > Listing Fields > Operands Field in the menu that opens, then uncheck Markup Register Variable References.
Disabling labels on registers
Jump tables
Jump tables give Ghidra’s disassembler some trouble, and require massaging to make them more readable.
An example occurrence of a jump table is FUN_08048f28.
A jump table with unknown data
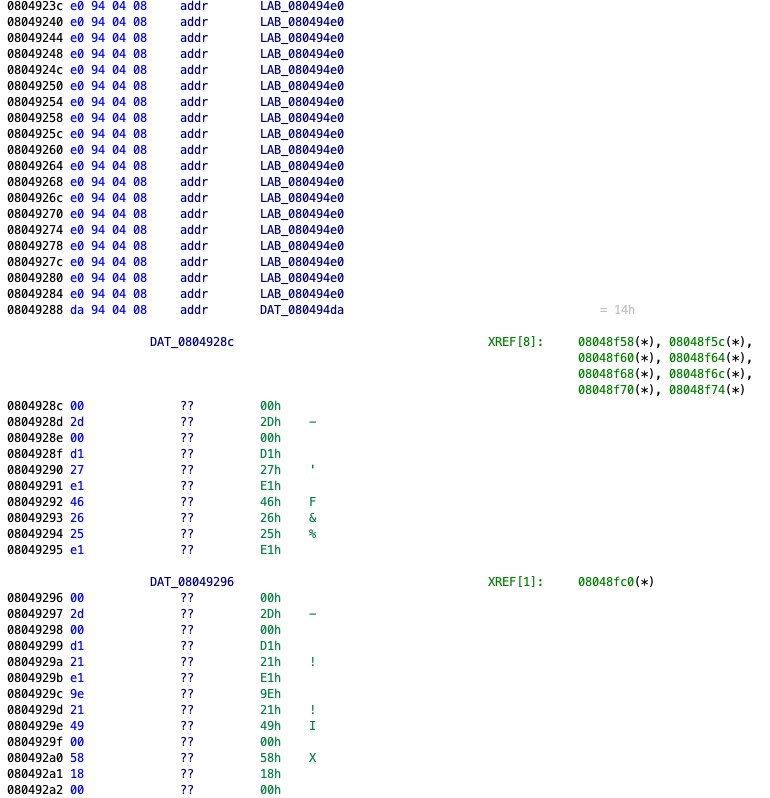
The jump table itself is correctly identified by Ghidra, but the logic in the case statements is not disassembled properly, so Ghidra shows raw data bytes instead of assembly code.
To manually disassemble this data into assembly instructions, right-click the data and Disassemble - Thumb. You can also use the hotkey ‘F12’.
Jump table code after manually disassembling
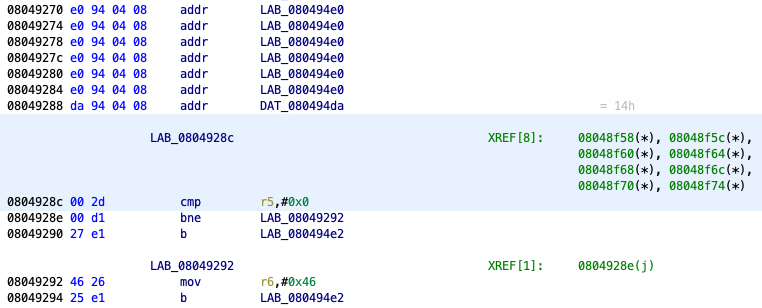
When a line of code is manually disassembled, Ghidra disassembles other lines of code that can be reached from the initial line, including by following branch instructions. For a jump table, this disassembles all the code for the switch case that was selected. You’ll need to disassemble all the other switch cases in the same way. I recommend disassembling each case individually instead of selecting all of them at once, as this reduces the risk of accidentally disassembling something that shouldn’t be disassembled, like a hard-coded data value.
Ghidra wrap-up
By now, we’ve explored enough of Ghidra’s functionality to get started on reading the assembly code for a game. Ghidra has a ton of other useful features for reverse engineering, so you may wish to explore on your own and discover which features strike your fancy.
Ghidra is great for analyzing code while the game is not running. While this can go far on its own, it is useful to supplement this by analyzing code in action while the game is running. The next section will focus on the debugging capabilities of mGBA.
Debugging with mGBA
When reverse engineering, it is often useful to inspect the state of the game while it is running, a process known as dynamic code analysis. This includes looking at memory values, stepping through assembly code execution, and inspecting registers. This section will give a brief survey of some of the debugging capabilities that mGBA provides.
Memory viewer
The memory viewer allows viewing and editing values in main memory. The memory viewer can be accessed at Tools > Game state views > View Memory…, and will bring up a window that looks like the image below. Note that you can select View Memory… multiple times to open multiple memory viewer windows.
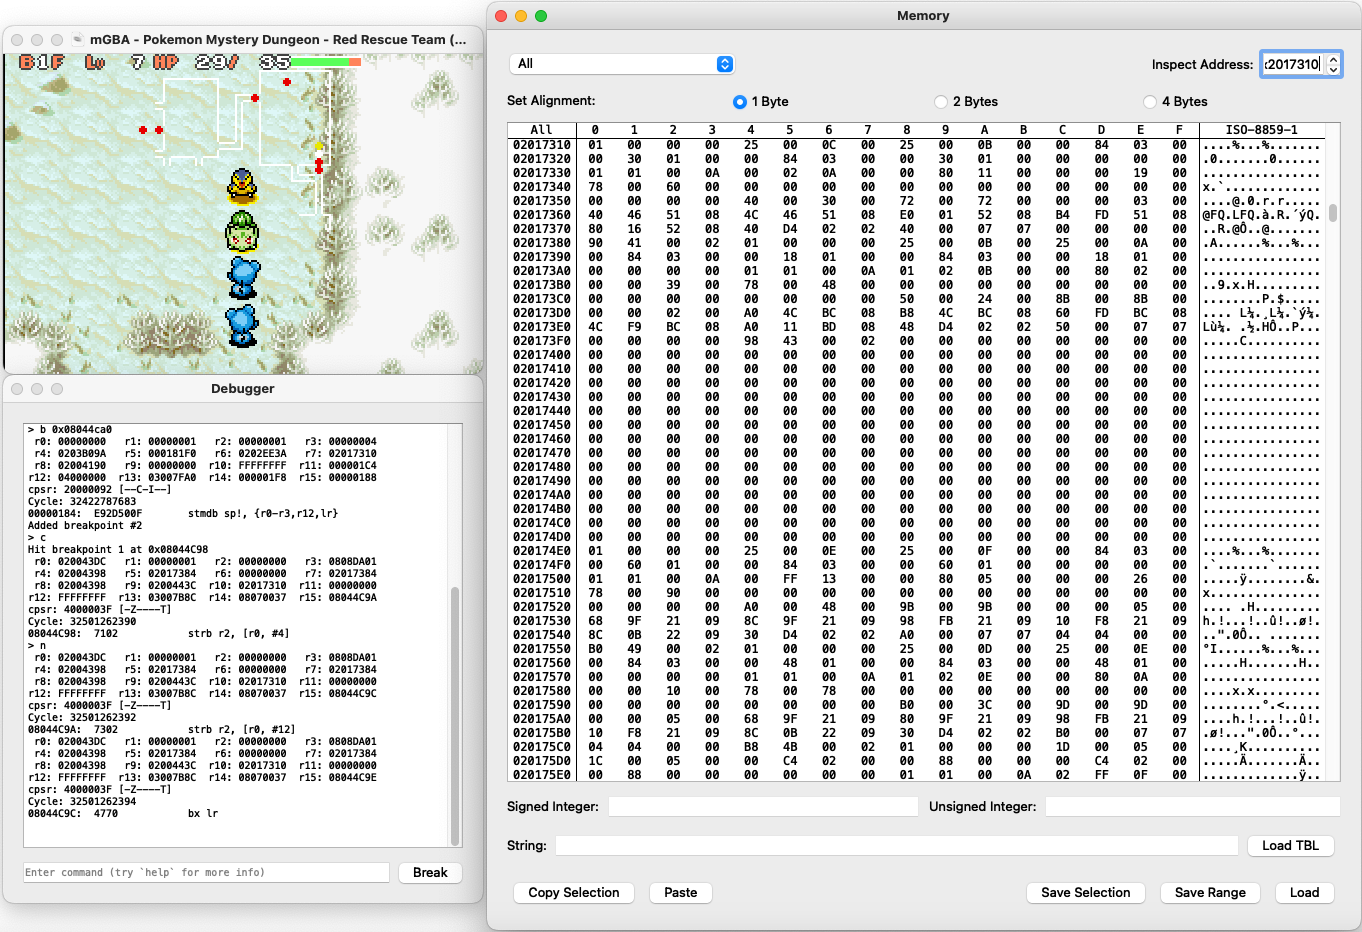
Memory viewer window
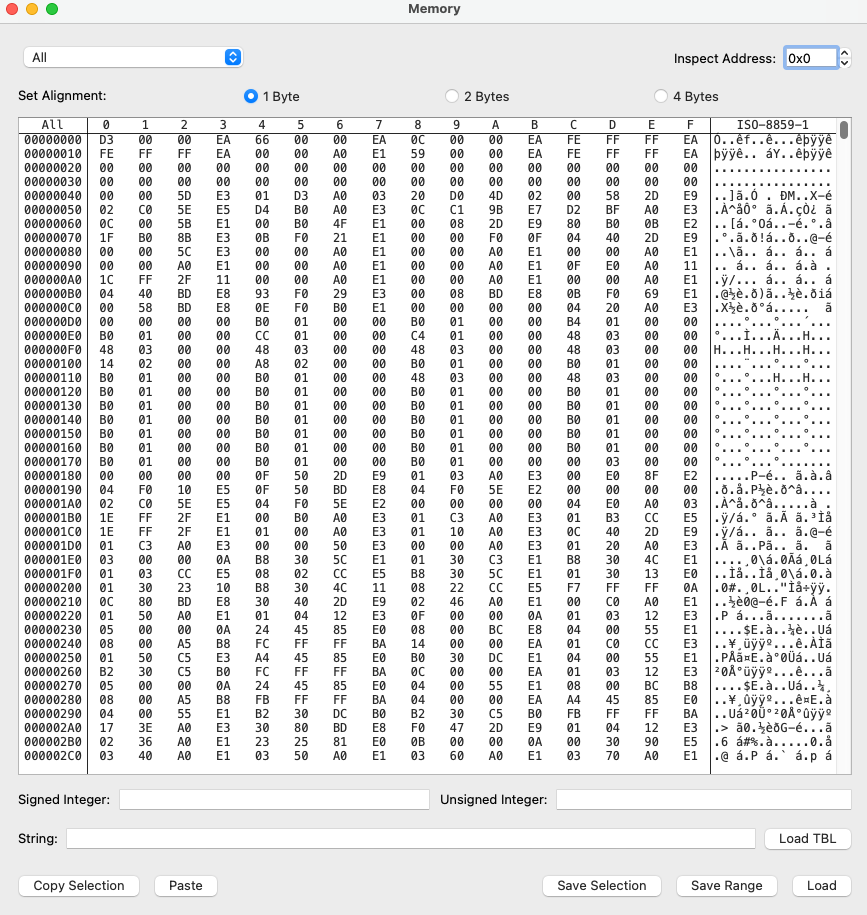
In the above image, the memory viewer shows the memory values from addresses 0x0 to 0x2DF. Byte data is displayed in a tabular format, with the first digit of the address as the column and multiples of 0x10 as the rows. For example, row 0x10 contains the values from addresses 0x10 to 0x1F, and the address 0x14 contains the value 0x66. Single bytes are shown by default, and it is possible to change this view to halfwords (2 bytes) or words (4 bytes) to help display larger values such as 4-byte pointers.
To the right of the memory table is a string representation of the data. This can be useful when browsing portions of memory that are intended to represent in-game text, or to quickly browse for patterns in the data.
You can click on a byte value in the table to select it. When a value is selected, you can also change the value, which will immediately be reflected in-game. Note that some values may immediately revert to the previous value if the game’s code sets the value every frame.
Per the GBA memory map, the addresses around 0x0 are internal BIOS values used by the GBA’s core systems, so they aren’t particularly interesting for our purposes. You can jump to any address in memory by entering the address into Inspect Address at the top right.
For a demonstration of the memory viewer’s capabilities, jump to address 0x2017310, which contains data about the player and partner Pokémon. Certain values around this address constantly change, which represents values changing in-game. In this case, several of the rapidly changing values here control the animations of the Pokémon on screen. If you move around in-game, you’ll notice additional variables changing, which represent values such as the position of the Pokémon on the screen and on the dungeon floor.
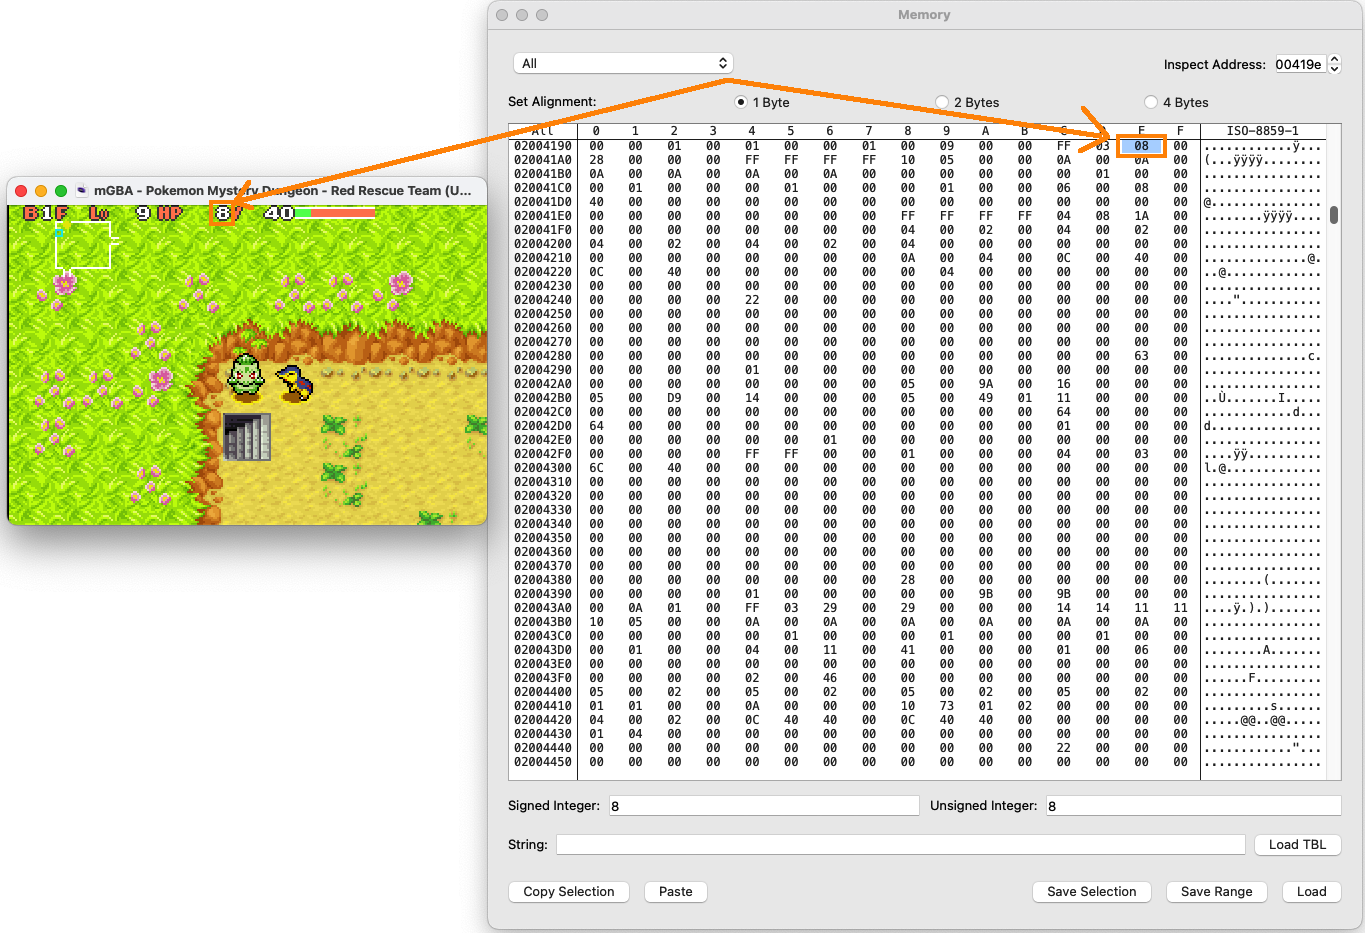
Next, jump to address 0x200419E. This area contains more values related to the player and partner Pokémon. Change the value at 0x200419E to 08, and you’ll notice that the player’s health (HP) changes in-game to match the value you entered.
Editing memory values
The memory viewer has other functionality such as saving/loading values in bulk, though I won’t go over these in this tutorial. Feel free to explore this functionality on your own.
Memory search
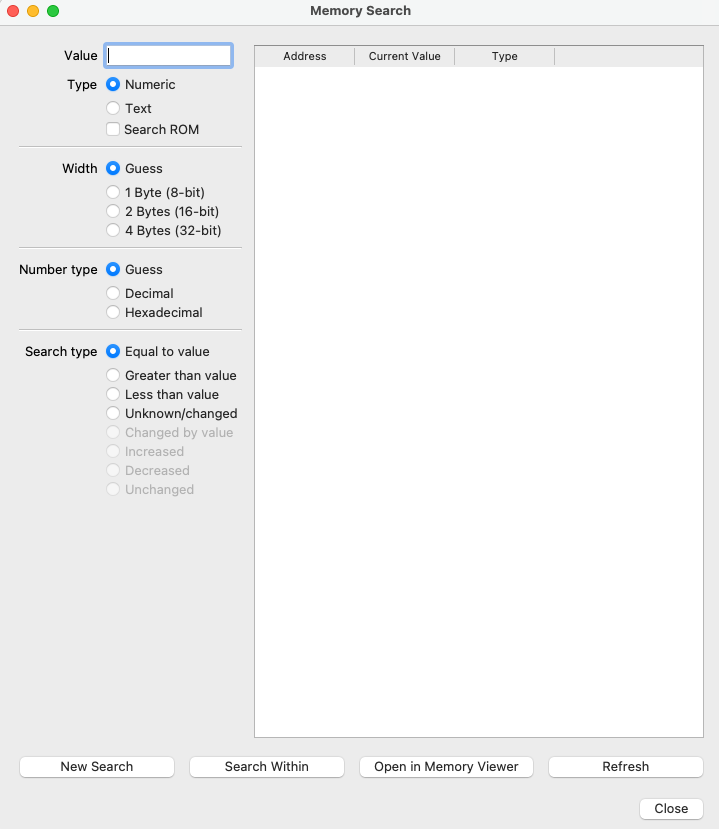
The memory search view allows searching memory for specific values. It can be acccessed via Tools > Game state views > Search memory…, which will bring up the window below.
Memory search window
The memory search is a valuable tool for finding the addresses of relevant in-game values. As an example, let’s use the memory search to locate which address the player’s HP is stored at.
To search for a value, enter the value to search for, configure the search using the available options, and press New Search. Let’s search for the player’s current HP, which we set to 8 earlier.
Searching for a value
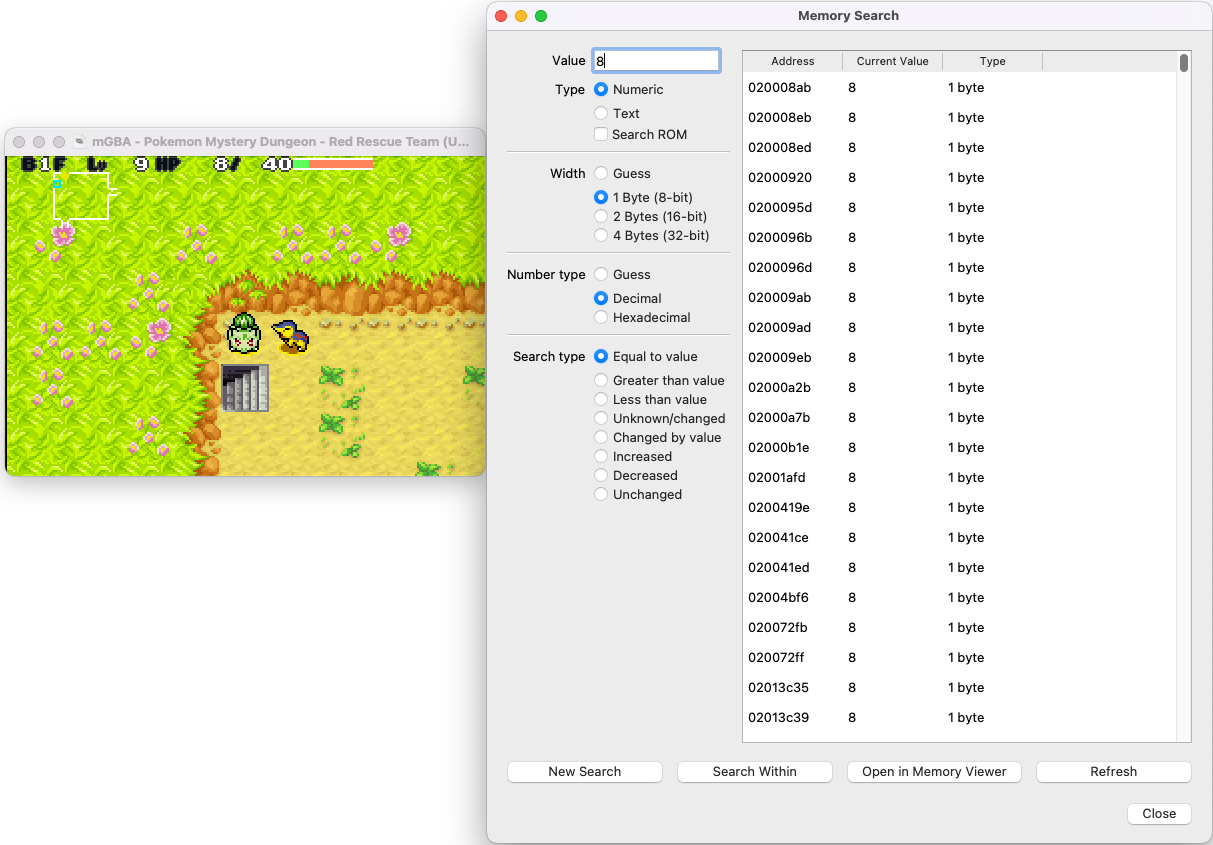
8 is a small value, so it commonly occurs throughout memory. We could scroll through each address in the search and try each of them to see which one represents the player’s HP, but there’s a better way.
Without closing the memory search, go back to the game and walk around for a bit until your HP regenerates to 9. Next, change the search type to Changed by value, change the search value to 1, and click Search Within. This will limit the search to the memory addresses found in the previous search, and look for any values that have increased by 1 from before. Since the previous search was for the value 8, this will search for any values that changed from 8 to 9 between the two searches.
Searching for changed values
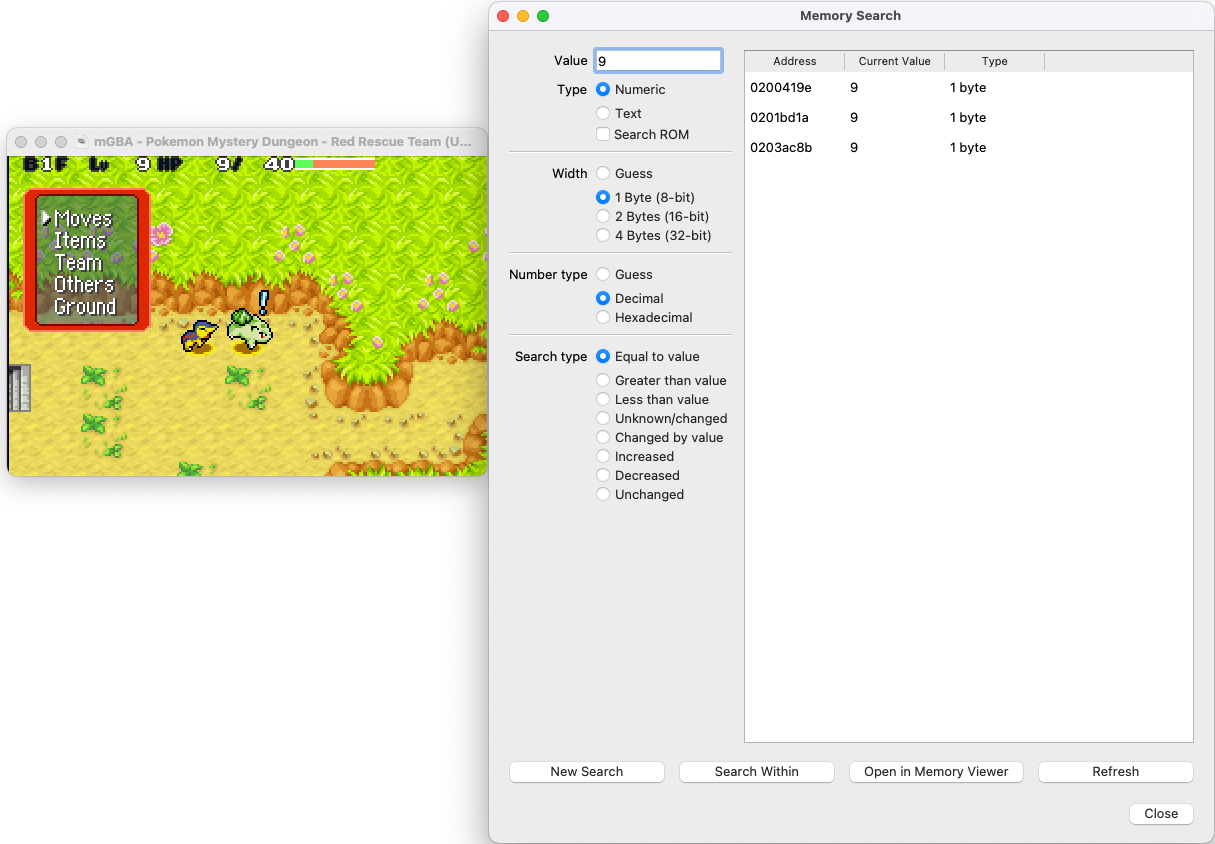
Now that the search is narrowed to a handful of values, you can try changing the values at each of these addresses to find which one controls the player’s HP. Note that you can select a search result and use Open in Memory Viewer to open the memory viewer at the selected address. You’ll find that the correct address is 0x200419E.
To set up the above example, we manually changed the player’s HP to 8, which requires knowing the address of the player’s HP ahead of time. If you didn’t already know the address, you could lower your HP through in-game means, such as finding an enemy and letting it attack you.
Debugger
In mGBA, the debugger is a console that exposes several useful debugging features, including setting breakpoints and watchpoints to pause game execution, stepping through assembly code as it runs, and viewing register values. The debugger is accessed via Tools > Open Debugger Console…, which will open the window below:
Debugger window
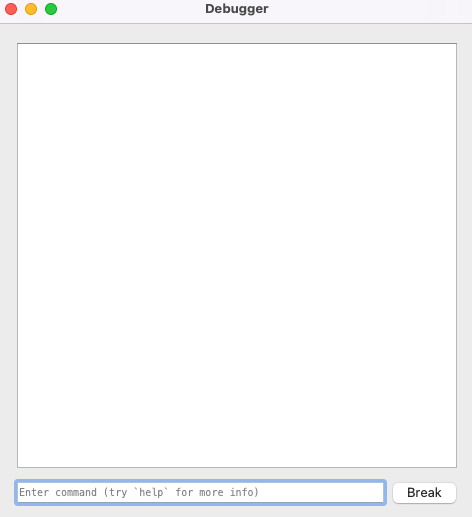
As stated in the console input box, you can use the h (help) command to view all available commands. This tutorial will go through a handful of the commands to introduce the debugging process.
Navigating debug mode
Let’s start by stopping the game execution at whatever piece of code it is currently running. Hit the Break button on the bottom right, which will pause the game and cause the debugger to output something like the following:
Example debugger break
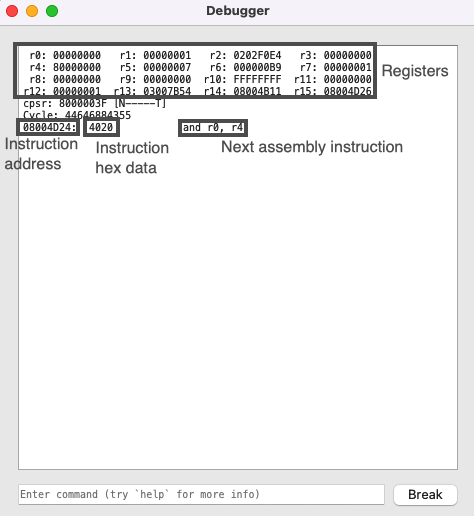
The image above displays a typical view of the current game state when the debugger pauses the game. At the top are the current values of all 16 registers, including the stack pointer (r13), link register (r14), and program counter (r15). At the bottom is the assembly instruction that will be executed next, along with the corresponding hex data for the instruction and the address where the instruction is stored.
You can use the n (next) command to execute the current instruction and pause on the next instruction.
Executing the next instruction while debugging
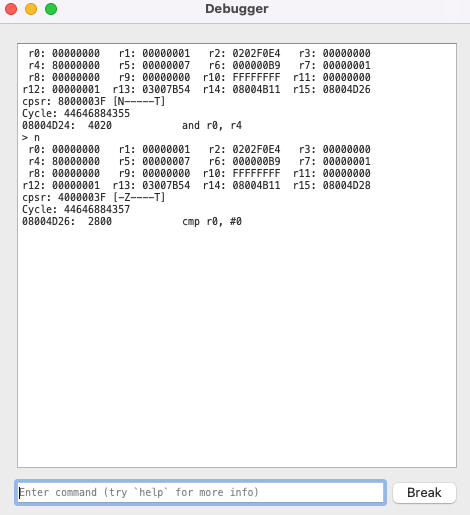
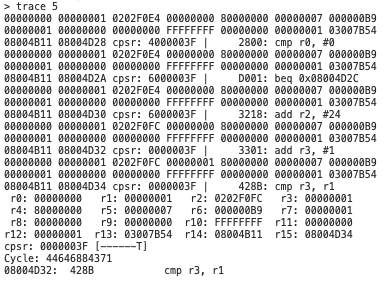
It is also possible to execute multiple instructions using the trace <count> command. For example, trace 5 is the equivalent of using the n command 5 times. Note that trace prints condensed game state views for each intermediate instruction to save space.
Tracing multiple instructions at once
To exit debugging, use the c (continue) command. This will cause the game to resume.
If you want to execute the same command you just executed, you can hit Enter with no command entered. This can be useful for commands like n. mGBA also keeps a history of executed commands, which you can access with the up/down arrows similar to a regular terminal window.
Reading/writing memory
The memory viewer can be used while the debugger has paused the game, though it is sometimes convenient to read/write memory values directly with the debugger console.
The read command uses the format r/<size> <address>, where <size> is 1, 2, or 4 bytes. For example, to read the player HP value from earlier, use the command r/1 0x200419E. The address can be expressed in either decimal or hex; the standard 0x prefix denotes a hex value.
Reading a memory value

Note that most debugger console commands will pause the game if it is not already paused.
Writing values to memory uses the format w/<size> <address> <write value>. For instance, the command w/1 0x200419E 20 will set the player’s HP to 20. Like the address, the write value can be either decimal or hex. There is also a w/r command to write a value to a register instead of memory.
Breakpoints
Similar to debuggers in higher-level languages, a breakpoint pauses program execution if a specific line of code is reached. This has several uses, like figuring out whether a line of code is reached when performing an action in-game, or stopping program execution at a specific function to debug it.
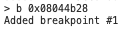
A breakpoint can be set using the b (break) command, with the format b <address>. As a demonstration, set a breakpoint at the beginning of the function FUN_08044b28 using b 0x8044B28. This will pause game execution, so unpause the game with the c command.
Adding a breakpoint
With the breakpoint added, try to move your character around in-game. This will execute FUN_08044b28 and hit the breakpoint, pausing the game’s execution.
Hitting a breakpoint
Just like hitting Break manually, you can now step through instructions and view register values with each instructions. Use the c command to resume the game. If you continue to move around, you’ll notice that the breakpoint is hit once each time you make an action, useful information for figuring out the purpose of the function.
To delete a breakpoint, use the d <index> (delete) command, where <index> is the index of the breakpoint to delete. The breakpoint’s index is outputted when adding the breakpoint and whenever the breakpoint is hit; for example, the breakpoint in the example above is breakpoint #1, and d 1 would delete this breakpoint.
The listb command will list all breakpoints currently added, along with each breakpoint’s index.
Watchpoints
A watchpoint pauses program execution if a specific address in memory is read from or written to. This is useful for finding which part of the code is used to manipulate a certain value in memory, and can also be used to track a memory value whose purpose hasn’t been figured out yet.
To set a watchpoint, use the command watch <address>. There are also variants of this command to watch only reads (watch/r), writes (watch/w), or changes (watch/c) to the address’s value. Like with breakpoints, watchpoints can be deleted with the same d <index> command. Listing watchpoints uses the listw command.
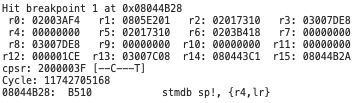
To demonstrate watchpoints, let’s watch the player’s HP value. Enter the command watch 0x200419E to add a watchpoint. Adding the watchpoint pauses the game, so use the c command to resume.
The watchpoint will be hit immediately, displaying the following:
Hitting a watchpoint
This information is similar to a breakpoint, but it additionally displays the value of the watched address for convenience. In the screenshot above, the HP value is 8, though it may be different in your game depending on what your HP value is.
If you continue game execution with c, the watchpoint will be hit again. Repeat this a few times, and you’ll notice that the HP value is repeatedly set to the same value it was already set to. This is potentially useful information, but if the watchpoint is hit constantly, then you can’t play the game and cause the value to change.
To mitigate this issue, delete the current watchpoint and create a change watchpoint with watch/c 0x200419E. This watchpoint will only pause program execution if the HP value is changed.
Now that the watchpoint doesn’t constantly trigger, you can move around until your HP naturally restores. When the HP restoration occurs, the watchpoint will pause the program.
Hitting a change watchpoint
The watchpoint will output both the new and previous values of the address. In the screenshot above, the HP value changed from 8 to 9.
Note that the instruction displayed by the watchpoint is the instruction after the instruction that accessed the watched address, meaning that the instruction that wrote to the HP value is at 0x8074C28. By looking up address 0x8074C28 in Ghidra, you’ll find the strh instruction used to set the HP value, within FUN_08074b54. This indicates that FUN_08074b54 handles passive HP restoration.
Save states
Save states are a standard part of most emulators, allowing the game’s state to be saved and loaded at any time. In addition to their standard gaming uses, save states can also be used at a more granular level while debugging the program.
mGBA has ten save state slots. To save or load a state, you can either use the menu options in File or use the commands save [1-10] and load [1-10]. If you are stepping through assembly code in the debugger, you can use the save/load commands to save and load while the program is at specific lines of code, which is useful for the debugging process if you want to step through code with the same game state multiple times.
mGBA wrap-up
We’ve seen some of the general tools in mGBA for inspecting and debugging the live game. The emulator has a number of more specialized tools that this tutorial won’t go into, such as viewing the currently loaded palettes, sprites, and backgrounds. You may wish to check them out on your own if those strike your fancy.
Reverse engineering strategies
With assembly knowledge, Ghidra, and mGBA, we have all the tools to start reverse engineering a game. The last section of this tutorial will discuss reverse engineering strategies to find where functionality lives in the ROM and in memory.
The mGBA section of this tutorial discusses a couple of strategies using memory search and watchpoints, so check those out if you haven’t already.
Following a value backwards through assembly
One way to find the location of a specific value is to trace related values backwards through the assembly to find where they came from. This might lead to the value you are looking for.
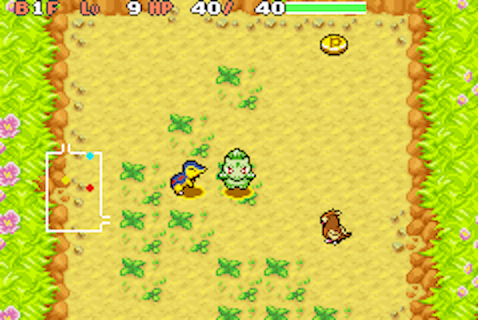
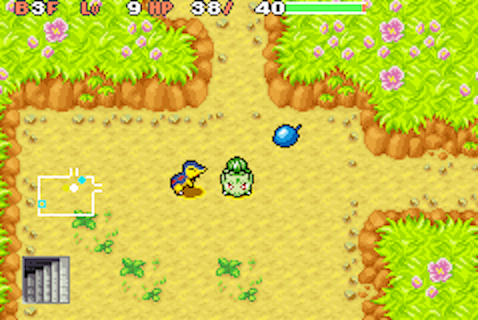
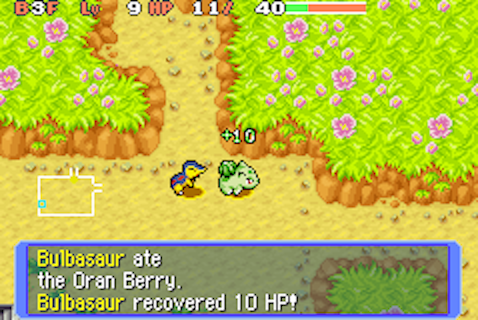
To demonstrate, let’s find the place in code that determines how many hitpoints (HP) a certain healing item will heal your character. In-game, explore the dungeon until you find a blue berry on the floor, called an Oran Berry. You might not find one on the floor you’re on; if you’ve explored the floor and found nothing, look for a staircase to proceed to the next floor and continue the search.
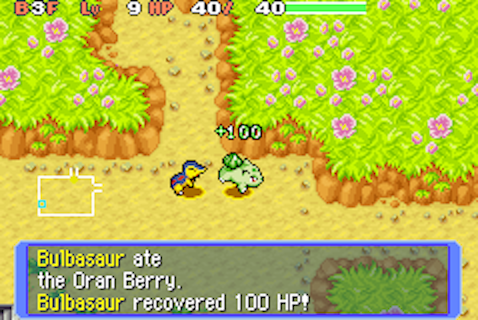
An Oran Berry on the ground to the top right of the player
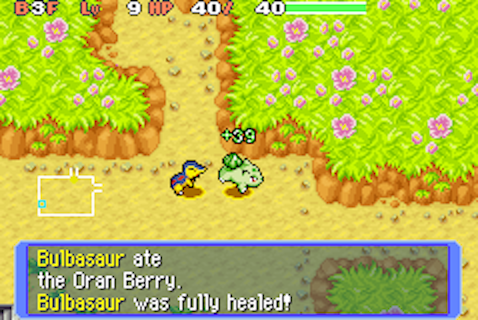
Once you find an Oran Berry, walk over it to pick it up. The berry heals 100 HP (up to your max HP), and our goal in this demonstration is to change the berry to heal only 10 HP. This requires knowing where the value 100 is stored within the game’s code.
You’ll need to have low HP to observe how much the berry heals, so use the command w/1 0x200419E 1 in the debugger console to set your HP to 1. Press B to open the menu, and go to Items to see the Oran Berry in your inventory. Make a save state so you can come back to this point, as you’ll be repeatedly eating the berry to debug what happens in code when you eat it. Once you’ve made a save state, select the berry and eat it, which will heal all of the player’s HP.
Normal Oran Berry behavior, healing up to 100 HP (capped at the player’s max HP)
Now that we’ve seen what the Oran Berry does normally, reload the save state and use the command watch/c 0x200419E to add a watchpoint on the player’s HP. Eat the berry again, which will hit the watchpoint.
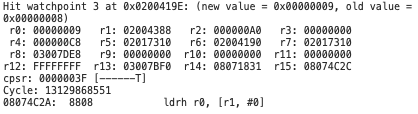
Hitting the player HP watchpoint after eating a berry
The watchpoint stopped at address 0x8077CD6, so go to address 0x8077CD6 in Ghidra. Look at the previous instruction, and you’ll see the strh r0,[r4,#0xe] that stored the new HP value. According to the watchpoint, the current value of r0 is 0x65 (101 in decimal). This lines up with the Oran Berry’s 100 HP of healing plus the player’s 1 HP. There is code later to cap the player’s HP at their max HP, but the uncapped HP is workable as is.
The two previous lines of assembly are also of note.
mov r3,r10
add r0,r2,r3
The 0x65 in r0 was the sum of r2 and r3, and looking at the current game state from the watchpoint, r2 matches the player’s HP of 1 while r3 matches the Oran Berry’s healing amount of 0x64 (100). Prior to the addition, we can see that the 0x64 in r3 was copied from r10.
Now let’s look for where the value 0x64 was assigned to r10. Middle-click r10 to highlight its usages, then scroll up in the function. There is another reference to r10 at 0x8077C8C with mov r3,r10, but this doesn’t assign to r10, so we can ignore it. Near the top of the function is what we are looking for, address 0x8077C54 with mov r10,r2.
Tracing the healing amount of the Oran Berry to the top of the function
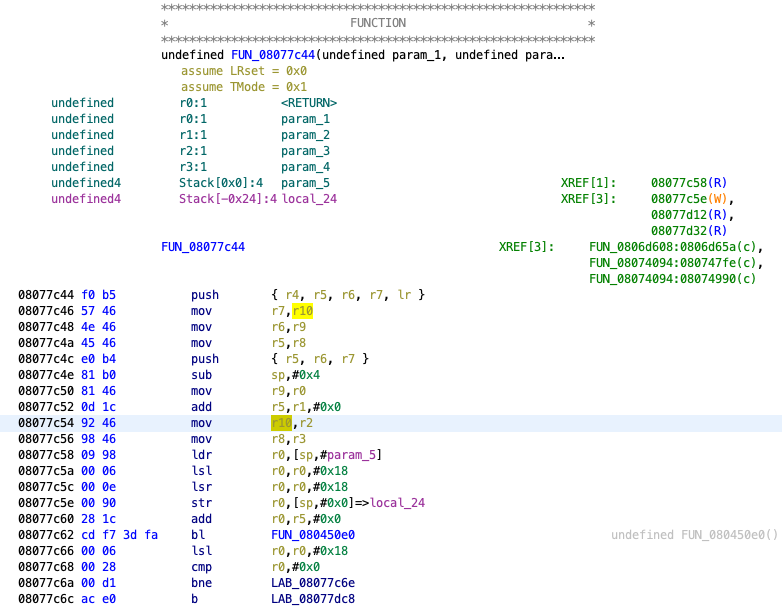
The 0x64 in r10 came from r2, but there are no more references to r2 between here and the start of the function. Remember that registers r0-r3 are designated for passing arguments into a function. This means that r2 is the third parameter of FUN_08077c44, and the 0x64 came from the code that called FUN_08077c44. The next step is to find the caller of this function.
Scroll to the bottom of FUN_08077cc44, and you’ll find the bx instruction at 0x8077DD6 marking the end of the function. Make a breakpoint in mGBA at 0x8077DD6, then continue program execution to hit the breakpoint. Note that before hitting the breakpoint, you’ll hit the watchpoint for player HP again; this is where the player’s HP is capped at their max HP.
Hitting the breakpoint at the end ofFUN_08077cc4
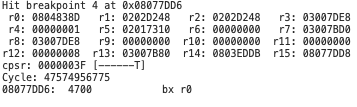
The breakpoint shows that r0 is 0x804838D. As the code is about to return from FUN_08077cc4, this is where the function will return to, and also where it was called. However, if you go to address 0x804838D in Ghidra, this section is not marked as assembly code.
Missing assembly code at 0x804838D
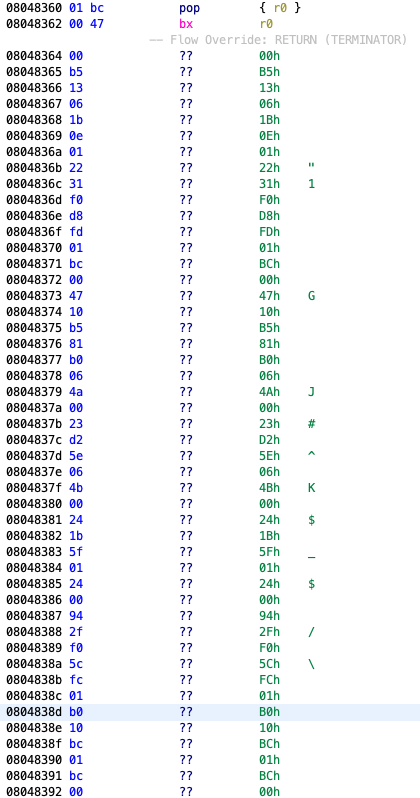
Sometimes Ghidra doesn’t auto-detect certain blocks of code as assembly. Select line 0x8048364 (directly after the last function that is already disassembled) and press F12 to disassemble this block of code as THUMB assembly. Ghidra will disassemble this line and also follow the assembly branches and function calls to disassemble subsequent lines of assembly, including line 0x804838D.
0x804838D and surrounding addresses after manually disassembling it
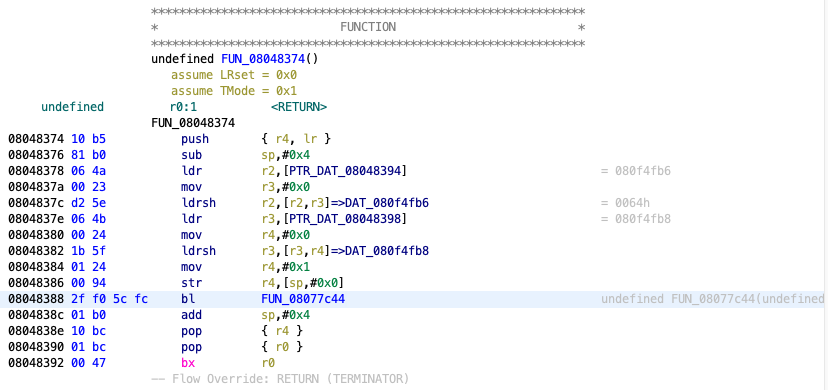
Now the call to FUN_08077cc44 is visible at address 0x8048388. We were looking for where r2 was assigned to 0x64, so look at the lines prior to the function call. We can see this set of instructions starting at 0x8048378.
ldr r2,[DAT_08048394]
mov r3,#0x0
ldrsh r2,[r2,r3]
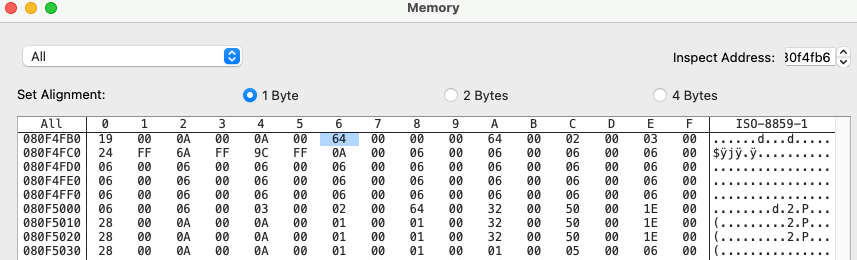
This loads an address into r2 from data value DAT_08048394, then loads the value at the address into r2. Look at address 0x8048394 to find that the value of DAT_08048394 is 0x80F4FB6. This is within ROM, which is promising; ROM cannot normally be written to, so chances are that this is the source of the value 0x64.
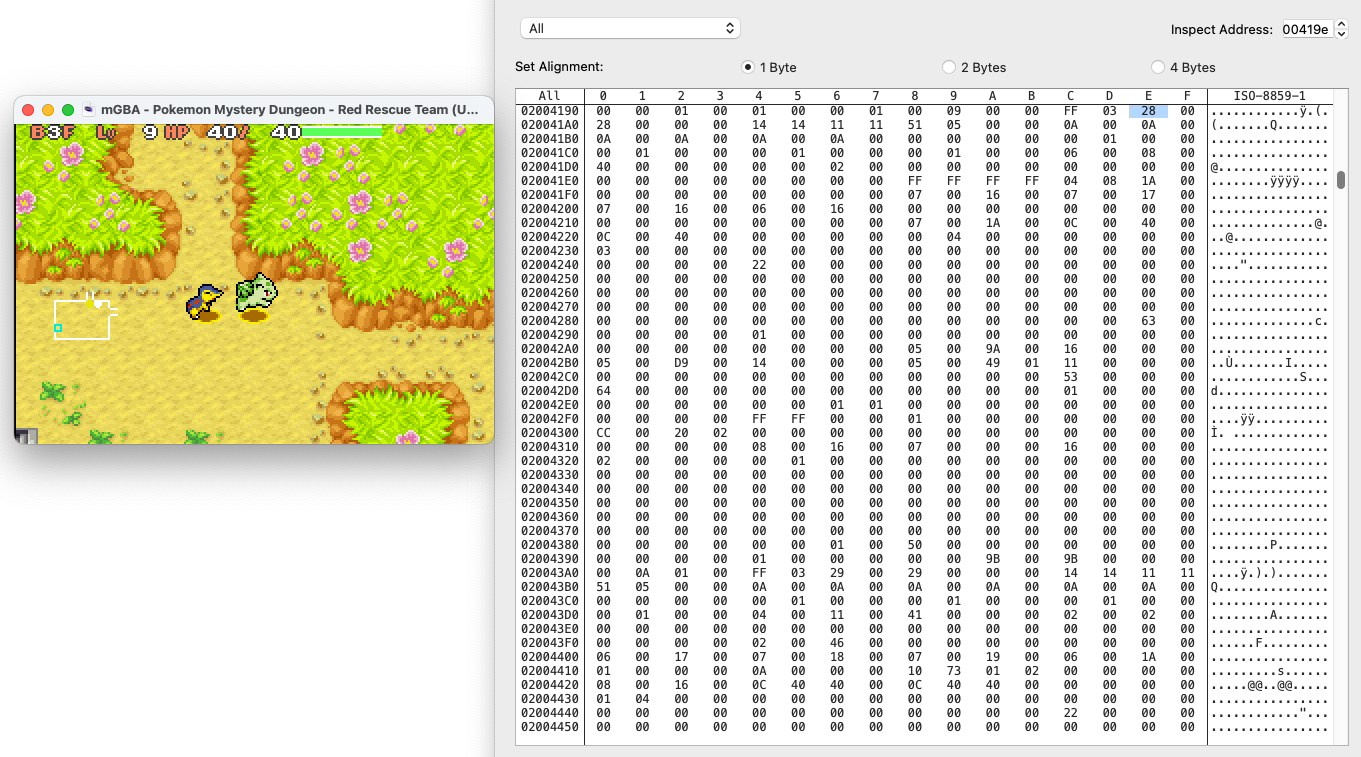
With this address in mind, go back to mGBA and go to address 0x80F4FB6 in the memory viewer. You will find the value 0x64 at the address, confirming that this is the location of the Oran Berry’s HP heal amount.
The location of the Oran Berry’s heal amount
To test the address we found for the heal amount, reload your save state, change the 0x64 at address 0x80F4FB6 to 0x0A in the memory viewer (0x0A = 10 in decimal), and eat the Oran Berry again to see how much it heals. Delete the watchpoint and breakpoint from earlier to avoid hitting them again now that we’re finished with them.
The changed Oran Berry heal amount
Success! We’ve found that the Oran Berry’s heal amount is stored at 0x80F4FB6. Technically, if you edited the game binary and changed the value at byte 0xF4FB6, you’d create a minimal ROM hack that nerfs the Oran Berry’s healing. Creating ROM hacks is out of the scope of this tutorial, but this demonstrates a piece of the process for creating these types of hacks.
Note that changed values in ROM in mGBA will not revert back if you load a save state. If you want to revert ROM values, you can either change them back manually or reload the ROM in the emulator.
Reading assembly forwards
Perhaps obviously, reading assembly forward is a way to figure out how game logic works.
Let’s explore the same functionality from the previous section (where the player’s HP is healed from a berry) and look for the code that caps the player’s HP at their max HP. Go back to address 0x8077CD6 in Ghidra.
Assembly code for healing the player with a berry
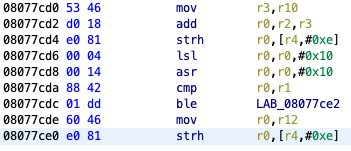
We saw that the instruction at 0x8077CD4, strh r0,[r4,#0xe], sets the player’s HP to the heal amount + the player’s current HP. At address 0x8077CDC, you can see a conditional ble statement that checks if r0 (the calculated heal amount) is less than r1. Alternatively, you can look at the decompilation to find this same conditional, where the calculated value is iVar3 and the player’s HP value is *(short *)(iVar4 + 0xe). If the conditional is not met, then another value is stored in the player’s HP (the strh r0,[r4,#0xe] at 0x8077CE0).
Since the player’s HP is accessed using an offset, this is an indicator that the player’s HP is within a struct, likely containing other values related to the player. The player’s HP is at offset 0xe in this struct.
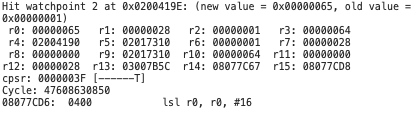
Although we could trace the values of r1 and r12 in the assembly, it might be easier to set a breakpoint/watchpoint at this spot again and see what the values are when the game is running.
The game state just before executing the instruction at 0x8077CD6
r1 and r12 are both equal to the player’s max HP. This means the code checks if the sum of the heal amount and the player’s current HP is greater than the max HP, and caps the player’s HP at its max HP if so. You can step through instructions with n to see this in action.
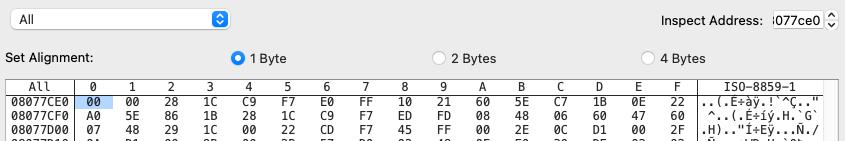
For further confirmation, we can change the strh instruction at 0x8077CE0 so that it doesn’t cap the player’s HP. In Ghidra, you can see that this instruction’s hex value is E0 81. In mGBA, go to address 0x8077CE0 in the memory viewer, and you’ll find the same E0 81 there. Change both of these bytes to 00, which will change the instruction to a no-op (an instruction that does nothing).
Changing the instruction at 0x8077CE0 to a no-op
Now let’s try eating a berry.
Removing the HP cap from healing (sort of)
The game now claims 100 HP was healed, and you may have noticed the HUD quickly flashing with a current HP greater than the max HP, but the HP was promptly reset back to the max HP afterwards. Evidently there’s another safety check elsewhere in the code to make sure the player’s HP doesn’t go over the max. However, the fact that the game showed the 100 HP of healing confirms that the code we were looking at is indeed a check to cap HP healing. If you wanted, you could add another watchpoint to the player’s HP and go through a similar process as before to find and disable the other checks.
Inspecting values near a known value
Once you’ve found the address of a value in memory, it’s likely that nearby values in memory are also related, possibly as part of a struct or array of data. We can use the memory viewer to look at other RAM values in the vicinity of the known value, and possibly discover more values by visual inspection or attempting to change them. This approach doesn’t have a specific goal in mind; instead, it is meant to discover a bunch of values quickly, laying groundwork to expedite searching for specific values later.
For this demonstration, we’ll use the address of the player’s HP that we found earlier in this tutorial. Open the memory viewer and go to address 0x200419E. Since the player’s HP is here, it’s reasonable to guess that other values related to the player character are here.
Looking at values near the player’s HP in memory
A value directly related to your HP is your maximum HP. Look in the in-game HUD for your max HP (directly to the right of your current HP), then try to find it in the memory viewer.
You won’t have to look very far. Two bytes ahead of your current HP is a number that matches your max HP, address 0x20041A0. Try to change this value, and you will see that your max HP changes on the HUD, confirming that 0x20041A0 is the player’s max HP.
Another number that is close by is the player’s level (labeled “Lv” on the HUD), which is 5 when you’ve just started the game. Look around the memory viewer for the value 5, and once you’ve found a possible value, try changing it to see if the player’s level changes in the HUD. The correct address is in the spoiler below.
Address of the player's level
0x2004199A related approach is to perform an action in-game and watch as values in memory change. This includes moving around, attacking, etc. To demonstrate this approach, press the Start button in the game to enter a mode where you can face a direction without moving. Turn around a couple of times while watching the memory viewer, and you’ll see the value at address 0x20041D6 changing. No other visible value changes, which is a good indicator that 0x20041D6 contains the direction the player was facing (encoded as an enum).
It’s also possible to use a trial-and-error approach by simply going through memory addresses, changing them, and seeing if this affects anything in game. For example, if you go through this process, eventually you’ll reach the address 0x2004238. Set this value to 1, and you’ll see the player character fall asleep, indicating that this value is used for the sleep status condition.
Discovering the address that controls whether the player is asleep

There’s no clear indicator of how far you can go with these approaches before you stop finding relevant information, so it’s up to you to decide when to stop and use one of the other strategies.
Searching for text
Larger blocks of text will often only appear once or a few times within memory, which can make them easier to locate.
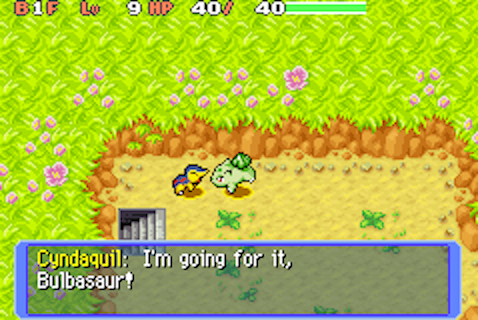
As an example, press the Start button to change the direction you’re facing, then turn to face your partner. Press A to speak to your partner.
Talking to your partner
This is enough dialogue to search for. Note that special characters like apostrophes may not always be encoded as regular ASCII characters, so avoid those if possible. Let’s search for “going for it” in memory. Select Text for the type and enable Search ROM.
Searching for dialogue in memory
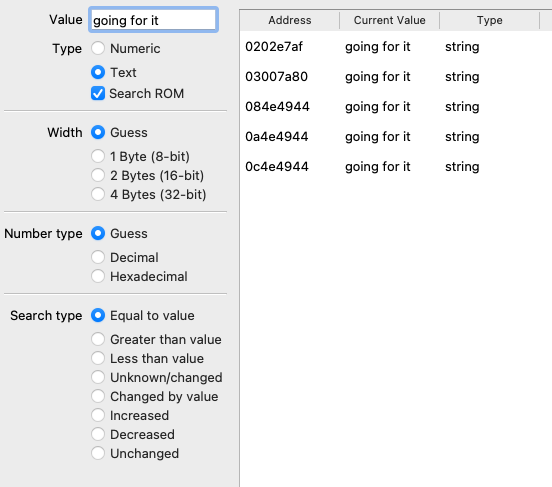
03007a80 is on the stack, so we can ignore that. For our purposes, 0a4e4944 and 0c4e4944 are in areas of the ROM that duplicate the 08XXXXXX portion of the ROM, so we can ignore those too. That leaves 0202e7af and 084e4944.
Memory regions a000000-bffffff and c000000-dffffff are known as “wait states” (per the GBA memory map), used internally by the CPU when processing instructions.
084e4944 is the only remaining search result within the ROM, so we can deduce that this is where the line of dialogue is stored within the ROM. 0202e7af is within RAM, so this is probably where the text is stored while displaying it in the dialogue box.
Chaining strategies
The strategies above are often chained together in the reverse engineering process. The general idea is to start from a known value and find another value that takes you closer to the functionality you are looking for. Repeat this to progressively discover more values that will help find what you are ultimately looking for.
For example, if you are looking for a more abstract concept such as how the AI works in the game, you might follow a series of steps like the following:
- Locate the player’s HP in memory by using the memory search to look for changes.
- Find an enemy to attack you, then add a watchpoint to the address of the player’s HP to find where in the code causes an attack to deal damage.
- From the damage-dealing code, follow the assembly backwards up to where the game decides that the enemy’s attack should deal damage. It may help to compare/contrast the code paths of a damaging attack and a non-damaging attack by using breakpoints. You may find a check for the attack’s unique ID to determine what effect the attack should have.
- Trace the assembly backwards and/or use watchpoints to find where the code sets the attack ID that the enemy will use. Chances are that this is a decision made by the enemy’s AI, which is your entry point into the enemy AI code.
- Follow the assembly forwards to figure out how the enemy’s AI works.
Using existing resources
If the game you are reverse engineering is at least decently popular, chances are that there is existing research done by others. Reverse engineering documentation can include information such as addresses of known data and functions, struct layouts, and code architecture, which can save you the trouble of having to discover them yourself and can serve as a starting point to discover further information about the game.
Note that hacking and reverse engineering resources for a game are typically fragmented and disorganized, with information strewn across Google Docs/Sheets, GitHub repos, Discord servers, Reddit posts, forums, wikis, and more. A starting point for finding reverse engineering resources for a game is Data Crystal, which contains an decent assortment of reverse engineering docs across games, along with links to external resources. For example, here is the Data Crystal page for Red Rescue Team. Google (or your favorite alternative search engine) is another option, and searching for terms like “<game name> hacking” may yield results. Keep an eye out for any active hacking and reverse engineering communities, like a Discord server or subreddit.
Some reverse engineering communities go a step further and maintain an in-progress or completed manual decompilation (decomp) or disassembly of a game, a project that uses source code or structured assembly code to build a game binary that matches the actual game’s ROM file. As these projects require all of the game’s code to build a matching binary, they often contain a large amount of labeled information about a game. For example, Red Rescue Team has an in-progress decompilation here. Manually decompiling is a highly technical sub-area of the reverse engineering space that is out of scope for this tutorial, though if one exists for the game you are reverse engineering, it’s useful to keep on your radar.
Conclusion
By now, you’ve set up a reverse engineering environment, learned the basics of assembly and some reverse engineering tools, and walked through some strategies to discover functionality in-game. From here, you are ready to dive into the code of your favorite GBA game and see what you can find. Mind you, the reverse engineering process is not always straightforward and requires plenty of ingenuity and patience, but it is a skill you can improve at with practice and persistence. Good luck!
If you’d like to reach me about this tutorial, you can find me (Some Body) on Discord in Pokémon Mystery Dungeon reverse engineering servers like SkyTemple and pret, or you can find me on Reddit as u/AnonymousRandPerson.